Editor's note: Any and all references to time frames longer than one trading day are for purposes of market context only, and not recommendations of any holding time frame. Daily rebalancing ETFs are not meant to be held unmonitored for long periods. If you don't have the resources, time or inclination to constantly monitor and manage your positions, leveraged and inverse ETFs are not for you.
Stock market volatility* returned with a vengeance recently after the carry trade in the Japanese Yen blew up. A flurry of selling hit global markets, but so far, there’s been a decent rally. The question now is whether this is just a short-covering rally before the next move lower, or perhaps we’ve seen enough capitulation and the bull market is set to resume.
Is Another Leg Lower Around the Corner?
Stocks just suffered their longest and sharpest decline of the year, leading many to become concerned as to the potential of an economic slowdown, or possibly even an imminent recession. Markets have a tendency to discount future events, and with the recent decline, some have even called for emergency rate cuts from the Federal Reserve.
To be clear, the economy is still growing as evidenced by the positive Gross Domestic Product (GDP)* data, but the rate of growth has slowed in recent months. The next GDP report is set to be released on August 29, and if we get a lower or even negative print, it could be the first major signal that an economic slowdown is on the horizon.
Traders that are concerned about the possibility of an economic slowdown may find a position with Direxion’s Daily S&P 500 Bear 3X Shares (Ticker: SPXS), which seeks daily investment results, before fees and expenses, of 300% of the opposite performance of the S&P 500 Index*.
Below is a daily chart of SPXS as of August 8, 2024.
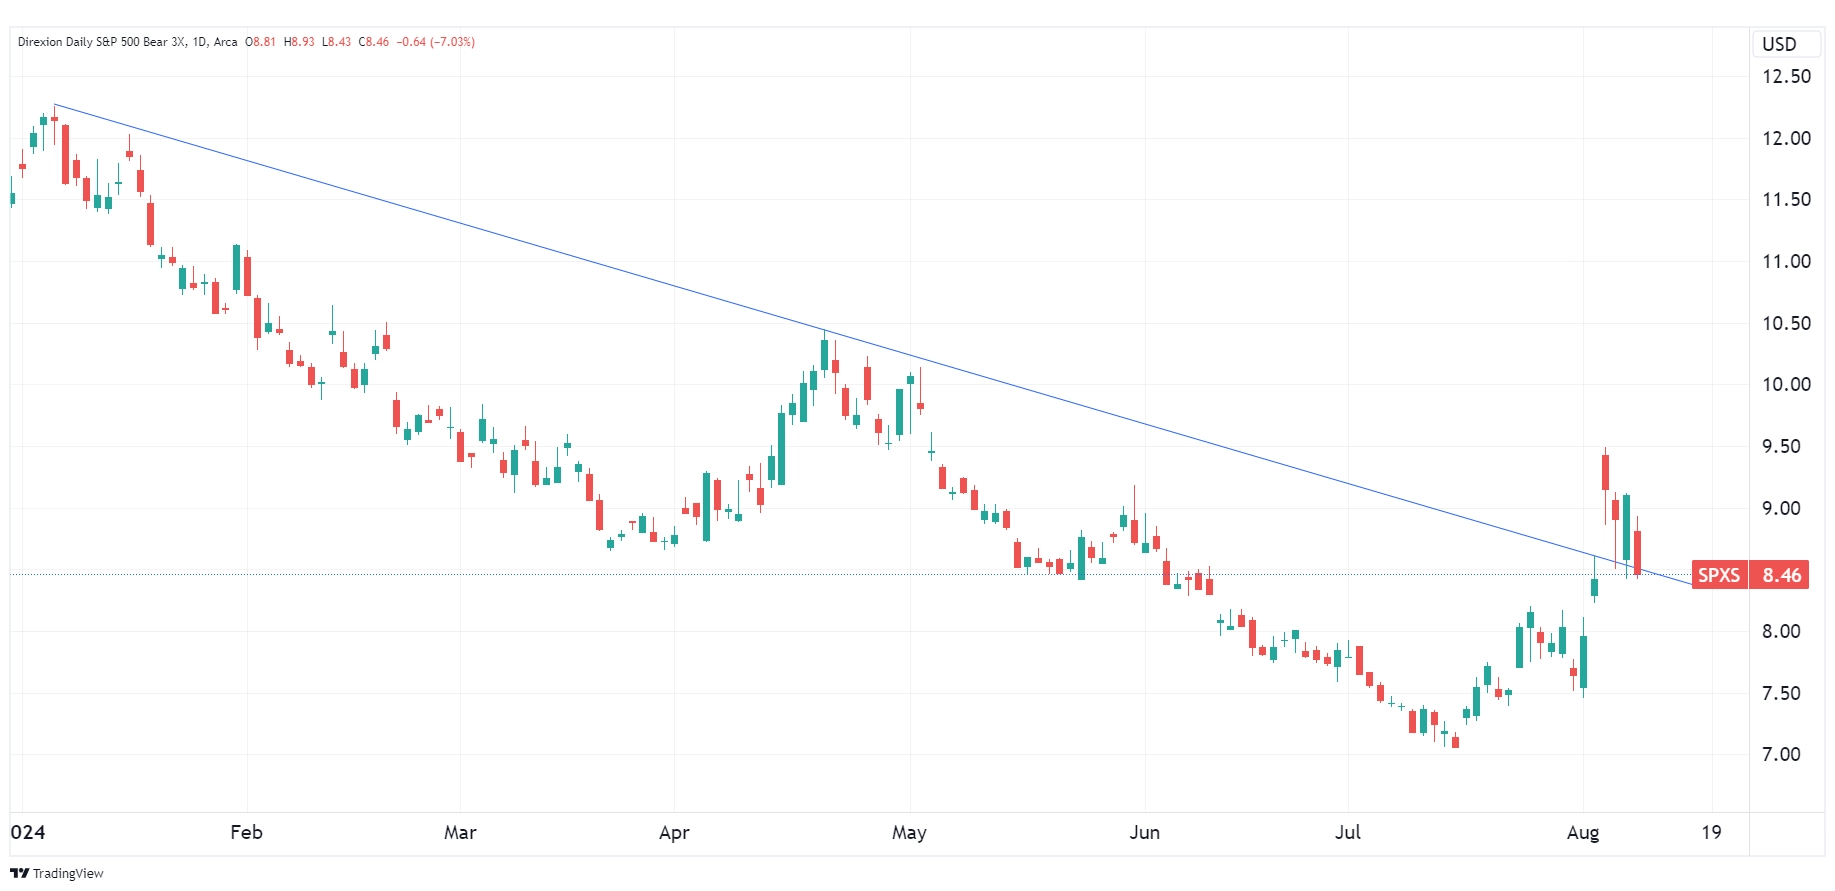
Source: TradingView.com
Candlestick charts display the high and low (the stick) and the open and close price (the body) of a security for a specific period. If the body is filled, it means the close was lower than the open. If the body is empty, it means the close was higher than the open.
The performance data quoted represents past performance. Past performance does not guarantee future results. The investment return and principal value of an investment will fluctuate. An investor’s shares, when redeemed, may be worth more or less than their original cost; current performance may be lower or higher than the performance quoted. For the most recent month-end performance go to Direxion.com/etfs. For standardized performance click here.
The slanted blue line represents a downtrend. A downtrend describes the price movement of a financial asset when the overall direction is downward.
A Dip Buying Opportunity?
One of the psychological phenomena in markets surrounding selloffs is that many who wish to have bought lower seldom actually do so when the opportunity presents itself. Despite the selloff in stocks, the technical trend in stocks remains higher, and the dip-buyers could come out in force soon.
Additionally, the Federal Reserve is expected to make their first interest rate cut at their September 18 meeting. The base expectation is a 25-basis point* rate cut, but if they surprised markets with a 50-basis point rate cut, it could be a catalyst for a more significant rebound in stock prices.
In this scenario, Direxion’s Daily S&P 500 Bull 3X Shares (Ticker: SPXL), which seeks daily investment results, before fees and expenses, of 300% of the performance of the S&P 500 Index, may see a nice rally.
Below is a daily chart of SPXL as of August 8, 2024.
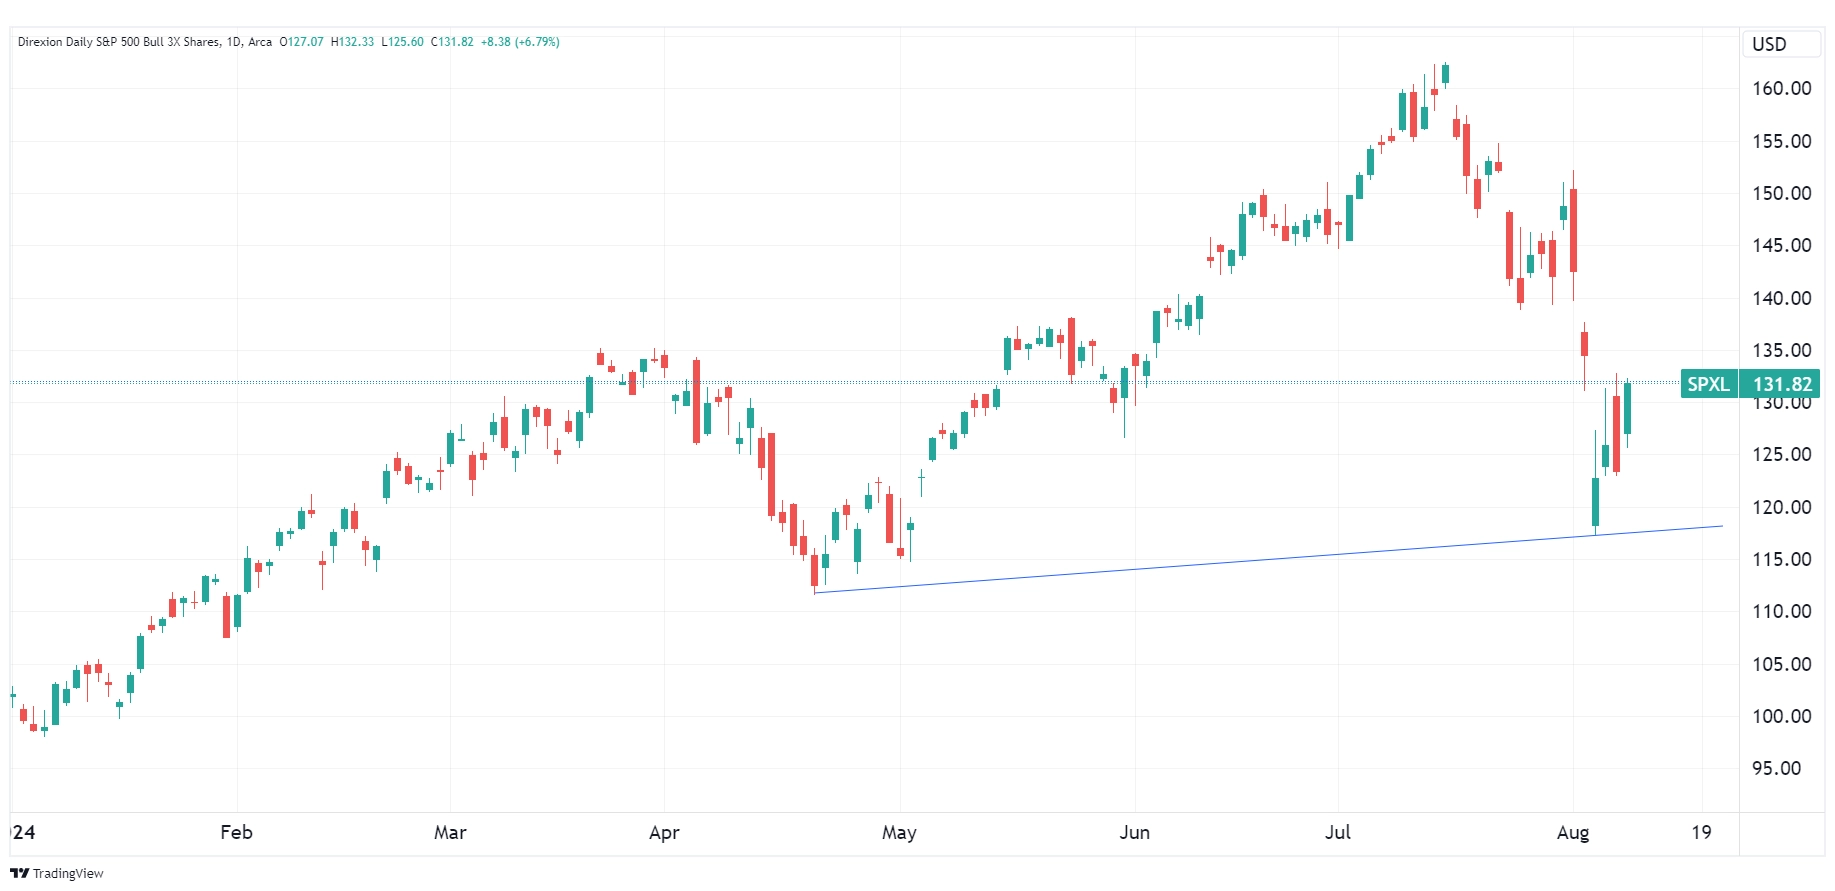
Source: TradingView.com
Candlestick charts display the high and low (the stick) and the open and close price (the body) of a security for a specific period. If the body is filled, it means the close was lower than the open. If the body is empty, it means the close was higher than the open.
The performance data quoted represents past performance. Past performance does not guarantee future results. The investment return and principal value of an investment will fluctuate. An investor’s shares, when redeemed, may be worth more or less than their original cost; current performance may be lower or higher than the performance quoted. For the most recent month-end performance go to Direxion.com/etfs. For standardized performance click here.
The blue lines represent an uptrend. An uptrend describes the price movement of a financial asset when the overall direction is upward.
Additional Market Cap and Sector Plays
Traders seeking to trade small cap stocks consider the Direxion Daily Small Cap Bull 3X Shares (Ticker: TNA) or the Direxion Daily Small Cap Bear 3X Shares (Ticker: TZA), which seek daily investment results, before fees and expenses, of 300%, or -300%, respectively, of the performance of the Russell 2000 Index*.
For those that wish to trade technology, which is the largest sector in the S&P 500, Direxion offers the Direxion Daily Technology Bull 3X Shares (Ticker: TECL) or the Direxion Daily Technology Bear 3X Shares (Ticker: TECS), which seek daily investment results, before fees and expenses, of 300%, or -300%, of the performance of the Technology Select Sector Index*.
*Definitions and Index Descriptions
An investor should carefully consider a Fund’s investment objective, risks, charges, and expenses before investing. A Fund’s prospectus and summary prospectus contain this and other information about the Direxion Shares. To obtain a Fund’s prospectus and summary prospectus call 866-476-7523 or visit our website at direxion.com. A Fund’s prospectus and summary prospectus should be read carefully before investing.
Leveraged and Inverse ETFs pursue daily leveraged investment objectives which means they are riskier than alternatives which do not use leverage. They seek daily goals and should not be expected to track the underlying index over periods longer than one day. They are not suitable for all investors and should be utilized only by sophisticated investors who understand leverage risk and who actively manage their investments.
The S&P 500® Index (SPXT) is designed to be comprised of stocks that are the 500 leading, large-cap U.S. listed issuers. The securities are selected on the basis of market capitalization, financial viability of the company, sector representation, public float, liquidity and price of a company’s shares outstanding. The Index is a float-adjusted, market capitalization-weighted index.
The Russell 2000® Index (RU20INTR) measures the performance of approximately 2,000 small-capitalization companies in the Russell 3000® Index, based on a combination of their market capitalization.
The Technology Select Sector Index (IXTTR) is provided by S&P Dow Jones Indices and includes domestic companies from the technology sector which includes the following industries: computers and peripherals; software; diversified telecommunications services; communications equipment; semiconductors and semi-conductor equipment; internet software and services; IT services; electronic equipment, instruments and components; wireless telecommunication services; and office electronics.
One cannot invest directly in an index.
The “S&P 500 Index” is a product of S&P Dow Jones Indices LLC (“SPDJI”), and has been licensed for use by Rafferty Asset Management, LLC (“Rafferty”). Standard & Poor’s® and S&P® are registered trademarks of Standard & Poor’s Financial Services LLC (“S&P”); Dow Jones® is a registered trademark of Dow Jones Trademark Holdings LLC (“Dow Jones”); and these trademarks have been licensed for use by SPDJI and sublicensed for certain purposes by Rafferty. Rafferty’s ETFs are not sponsored, endorsed, sold or promoted by SPDJI, Dow Jones, S&P, their respective affiliates and none of such parties make any representation regarding the advisability of investing in such product(s) nor do they have any liability for any errors, omissions, or interruptions of the S&P 500® Index.
Direxion Shares Risks – An investment in the Fund involves risk, including the possible loss of principal. The Fund is non-diversified and includes risks associated with the Fund concentrating its investments in a particular industry, sector, or geographic region which can result in increased volatility. The use of derivatives such as futures contracts and swaps are subject to market risks that may cause their price to fluctuate over time. Risks of the Fund include Effects of Compounding and Market Volatility Risk, Derivatives Risk, Market Risk, Counterparty Risk, Rebalancing Risk, Shorting or Inverse Risk, Cash Transaction Risk, Intra-Day Investment Risk, Daily Inverse Index Correlation Risk, Other Investment Companies (including ETFs) Risk, Passive Investment and Index Performance Risk, and risks specific to the securities that comprise the S&P 500® Index. Please see the summary and full prospectuses for a more complete description of these and other risks of the Fund.