$SPDN: Hard Landing Fear, Earnings Jitters. Need an (H)edge?
Editor's note: Any and all references to time frames longer than one trading day are for purposes of market context only, and not recommendations of any holding time frame. Daily rebalancing ETFs are not meant to be held unmonitored for long periods. If you don't have the resources, time or inclination to constantly monitor and manage your positions, leveraged and inverse ETFs are not for you.
So far, August is living up to its reputation as a rocky month for the markets. The Cboe Volatility Index (VIX)*, Wall Street’s fear gauge, spiked above 60 during the recent sell-off to its highest level since the pandemic.
The abrupt reversal appears to be driven by a combination of several factors. Perhaps most importantly, in currency markets, the yen spiked after the Bank of Japan raised interest rates. This rate hike triggered a rapid unwinding of popular carry trades that spilled over to other risk assets like equities, CNBC reports.
Below is a daily chart of the S&P 500 Index as of August 5.
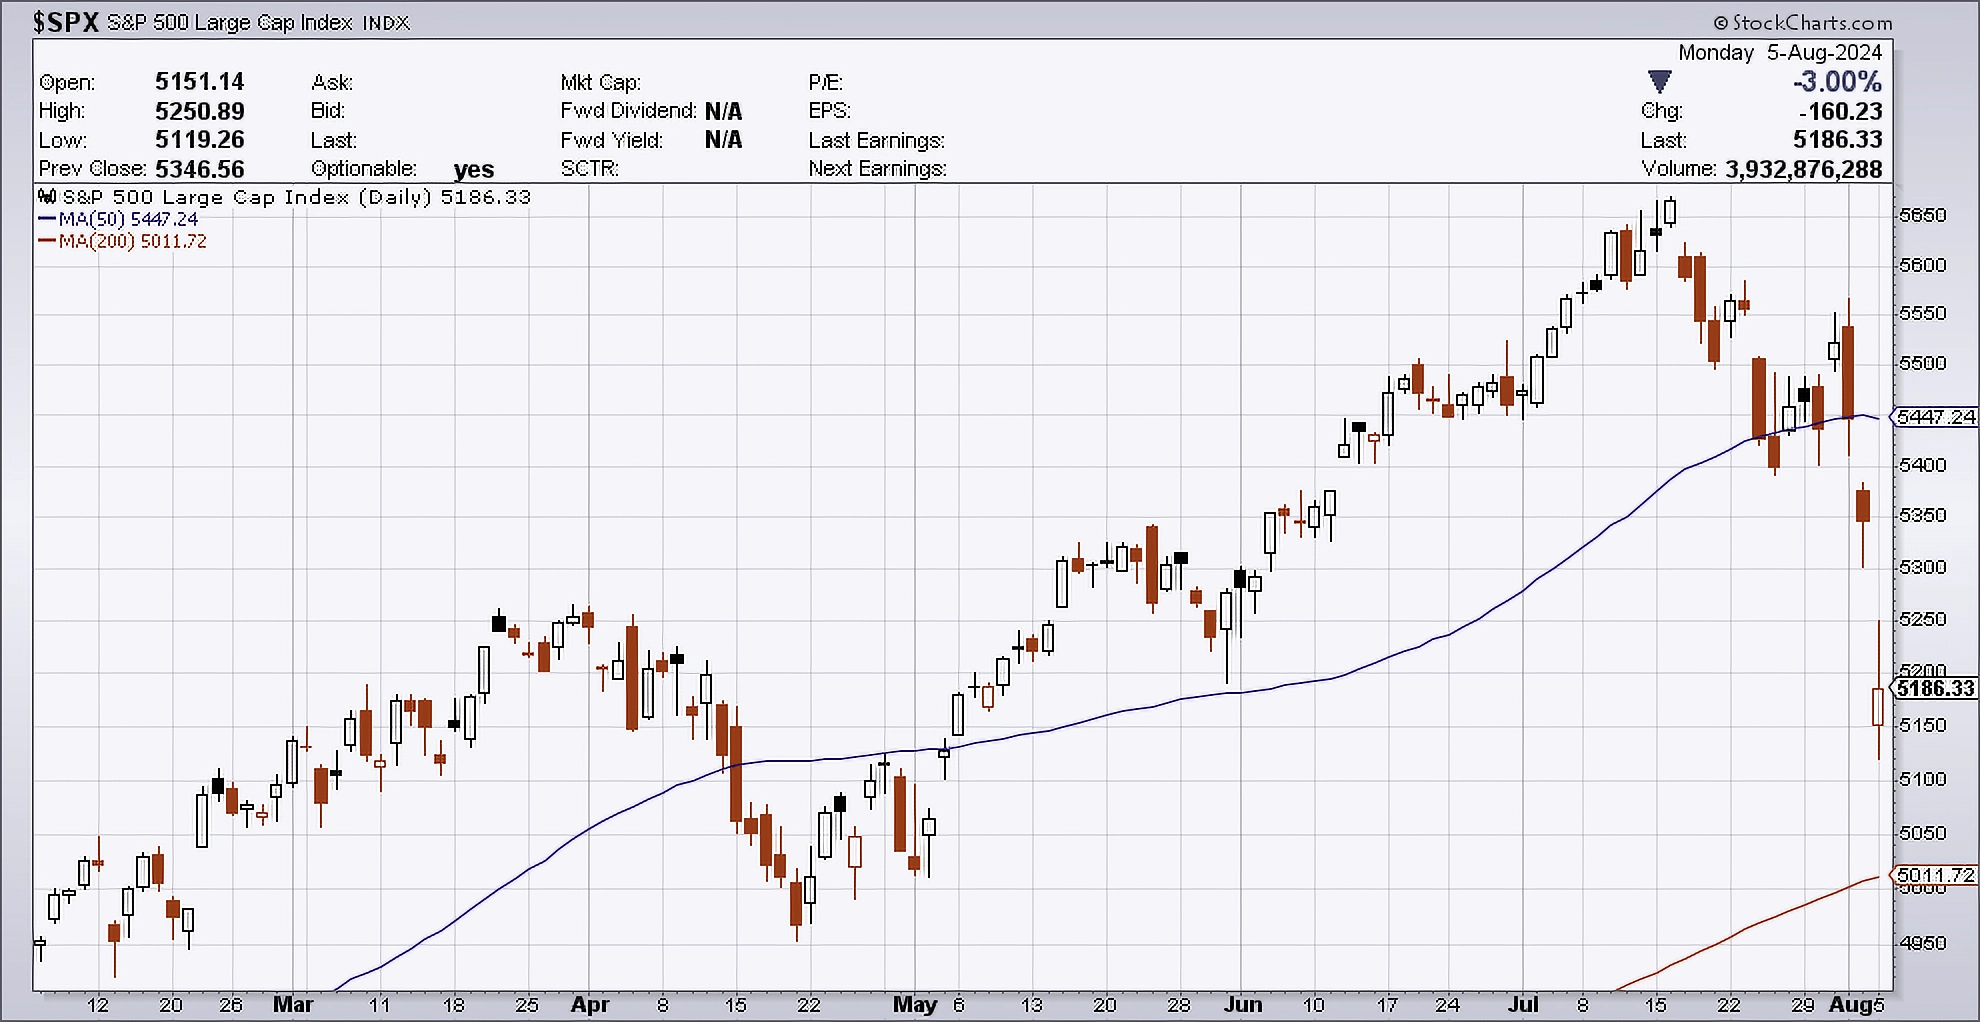
Source: StockCharts.com, August 5, 2024.
Candlestick charts display the high and low (the stick) and the open and close price (the body) of a security for a specific period. If the body is filled, it means the close was lower than the open. If the body is empty, it means the close was higher than the open.
The performance data quoted represents past performance. Past performance does not guarantee future results.
Here are some other crosswinds that contributed to the recent wipeout:
- Hard Landing Fears: The July U.S. jobs report was much softer than expected as the unemployment rate rose to 4.3%, the highest level in three years, CNN reported. Although inflation* has been one of investors’ primary concerns in recent years, the narrative looks to have quickly shifted to fears of an economic slowdown and potential Federal Reserve rate cuts. Keep an eye out for the August nonfarm payrolls report, which is scheduled to cross on September 6.
- Earnings Jitters: The S&P 500 was enjoying a decent year until the recent rough patch, which hit tech leaders and the highflying semiconductor sector. Chip giant Intel (NASDAQ: INTC) saw one of the biggest one-day drawdowns in its history after the company reported weak quarterly earnings while announcing job cuts and a suspension of its dividend, Yahoo Finance reports. Amazon (NASDAQ: AMZN) also disappointed the Street with its second-quarter results and outlook. Looking ahead, market darling Nvidia (NASDAQ: NVDA) is expected to report quarterly earnings on August 28 while Salesforce’s (NYSE: CRM) results expected on September 4 could set the tone for the beleaguered software sector.
- Federal Reserve Uncertainty: Markets are recalibrating their expectations for Federal Reserve rate cuts after the wild moves in markets lately. For the September 18 Fed announcement, traders are pricing in a 25-50-basis-point* cut as the most likely outcome, according to CME FedWatch as of August 5. The Fed minutes from the July meeting, expected to cross on August 21, may provide some hints about September.
Trading and Hedging with the S&P 500 in Volatile Markets
Traders may want to brace for more volatility* based on weak seasonal factors and a host of potential catalysts discussed above. Of course, that also creates trading opportunities in both directions as the market attempts to find its footing after the recent shock to the system.
Traders looking for a hedge for existing long positions may want to consider the Direxion Daily S&P 500 Bear 1X Shares (Ticker: SPDN). SPDN seeks daily investment results, before fees and expenses, 100% of the inverse (or opposite) of the S&P 500 Index.
For traders looking to play the S&P 500 with leverage in both directions, the Direxion Daily S&P 500 Bull 3X Shares (Ticker: SPXL) and the Direxion Daily S&P 500 Bear 3X Shares (Ticker: SPXS) seek daily investment results, before fees and expenses, of 300%, or 300% of the inverse (or opposite), of the performance of the S&P 500 Index.
*Definitions and Index Descriptions
An investor should carefully consider a Fund’s investment objective, risks, charges, and expenses before investing. A Fund’s prospectus and summary prospectus contain this and other information about the Direxion Shares. To obtain a Fund’s prospectus and summary prospectus call 866-476-7523 or visit our website at direxion.com. A Fund’s prospectus and summary prospectus should be read carefully before investing.
Leveraged and Inverse ETFs pursue daily leveraged investment objectives which means they are riskier than alternatives which do not use leverage. They seek daily goals and should not be expected to track the underlying index over periods longer than one day. They are not suitable for all investors and should be utilized only by sophisticated investors who understand leverage risk and who actively manage their investments.
The Cboe Volatility Index (VIX) is a calculation designed to produce a measure of constant, 30-day expected volatility of the U.S. stock market, derived from real-time, mid-quote prices of S&P 500® Index (SPX℠) call and put options.
The S&P 500® Index (SPXT) is designed to be comprised of stocks that are the 500 leading, large-cap U.S. listed issuers. The securities are selected on the basis of market capitalization, financial viability of the company, sector representation, public float, liquidity and price of a company’s shares outstanding. The Index is a float-adjusted, market capitalization-weighted index.
One cannot invest directly in an index.
The “S&P 500 Index” is a product of S&P Dow Jones Indices LLC (“SPDJI”), and has been licensed for use by Rafferty Asset Management, LLC (“Rafferty”). Standard & Poor’s® and S&P® are registered trademarks of Standard & Poor’s Financial Services LLC (“S&P”); Dow Jones® is a registered trademark of Dow Jones Trademark Holdings LLC (“Dow Jones”); and these trademarks have been licensed for use by SPDJI and sublicensed for certain purposes by Rafferty. Rafferty’s ETFs are not sponsored, endorsed, sold or promoted by SPDJI, Dow Jones, S&P, their respective affiliates and none of such parties make any representation regarding the advisability of investing in such product(s) nor do they have any liability for any errors, omissions, or interruptions of the S&P 500® Index.
Direxion Shares Risks – An investment in the Fund involves risk, including the possible loss of principal. The Fund is non-diversified and includes risks associated with the Fund concentrating its investments in a particular industry, sector, or geographic region which can result in increased volatility. The use of derivatives such as futures contracts and swaps are subject to market risks that may cause their price to fluctuate over time. Risks of the Fund include Effects of Compounding and Market Volatility Risk, Derivatives Risk, Market Risk, Counterparty Risk, Rebalancing Risk, Shorting or Inverse Risk, Cash Transaction Risk, Intra-Day Investment Risk, Daily Inverse Index Correlation Risk, Other Investment Companies (including ETFs) Risk, Passive Investment and Index Performance Risk, and risks specific to the securities that comprise the S&P 500® Index. Please see the summary and full prospectuses for a more complete description of these and other risks of the Fund.