Tech About to Rocket to New Highs, or Just Buffering?

Editor's note: Any and all references to time frames longer than one trading day are for purposes of market context only, and not recommendations of any holding time frame. Daily rebalancing ETFs are not meant to be held unmonitored for long periods. If you don't have the resources, time or inclination to constantly monitor and manage your positions, leveraged and inverse ETFs are not for you.
After experiencing a rough stretch over the past couple of months, the technology sector is starting to show signs of new life. Obviously, technological advancements in areas like artificial intelligence (AI), cloud computing, and semiconductors are helping. And with the promise of more game-changing innovations to come, can the tech sector finally find its way to new highs?
Is the Next Wave of Innovation Around the Corner?
Looking ahead to next year, there is no shortage of optimism in the tech industry. Artificial intelligence, automation, and cloud-based technologies are being pushed into the mainstream, with major players like NVIDIA Corporation, Microsoft Corporation, and Alphabet, Inc. capitalizing on these opportunities.
If these developments continue to show promising results, and if consumer demand remains strong for tech products and services, the sector should continue to see substantial growth in the near term.
We’re halfway through earnings season now, and results from some of these big tech names have been positive. And for the most part, guidance issued by these companies has been positive. If momentum continues, it will help tech bulls in the near-term.
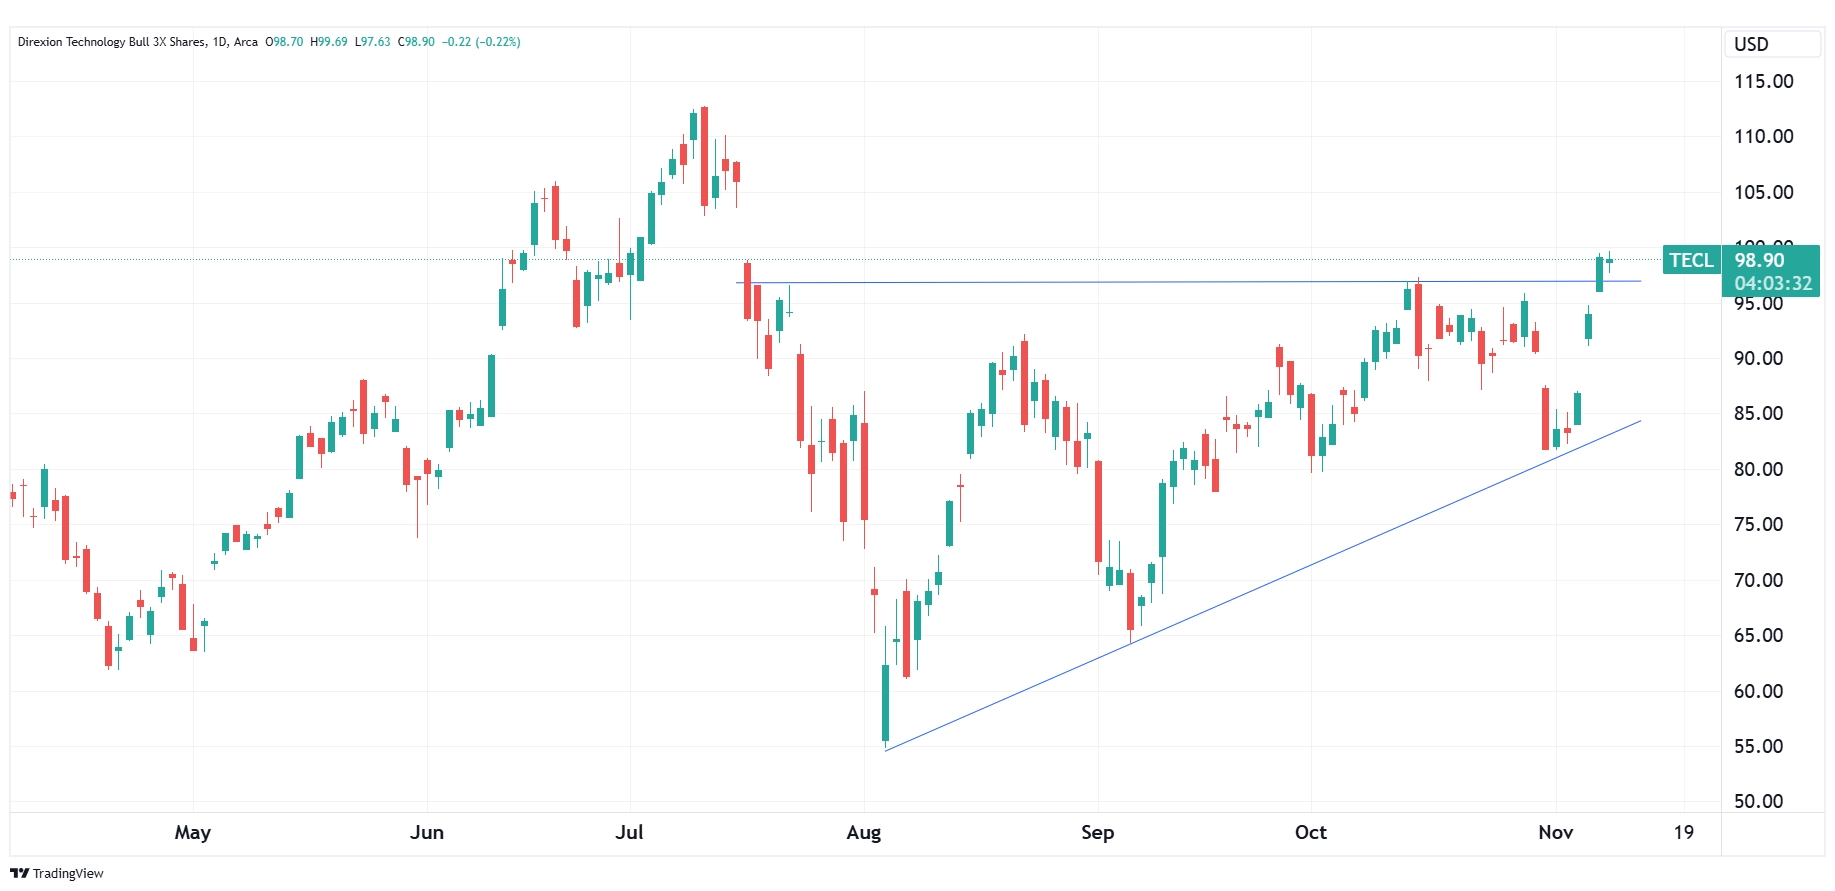
In this situation, Direxion’s Daily Technology Bull 3X Shares (Ticker: TECL) could see a strong rally. This fund seeks daily investment results, before fees and expenses, of 300% of the performance of the Technology Select Sector Index*.
Below is a daily chart of TECL as of November 8, 2024.

Source: TradingView.com
Candlestick charts display the high and low (the stick) and the open and close price (the body) of a security for a specific period. If the body is filled, it means the close was lower than the open. If the body is empty, it means the close was higher than the open.
The performance data quoted represents past performance. Past performance does not guarantee future results. The investment return and principal value of an investment will fluctuate. An investor’s shares, when redeemed, may be worth more or less than their original cost; current performance may be lower or higher than the performance quoted. For the most recent month-end performance go to Direxion.com/etfs. For standardized performance click here.
The Overheating Warning in the Background
Despite the generally bullish sentiment in the tech space now, there’s been a sharp rise in long-term interest rates over the past several weeks, which warns that inflationary pressures could be building.
Traders would be wise to keep an eye on the inflation* report on December 11. If it comes in above estimates, it could warn that the rise in long-term rates has already begun. Note that this phenomenon is taking place despite the Fed lowering rates on the short-end of the curve. This may turn into a headwind for the tech sector, especially if it continues.
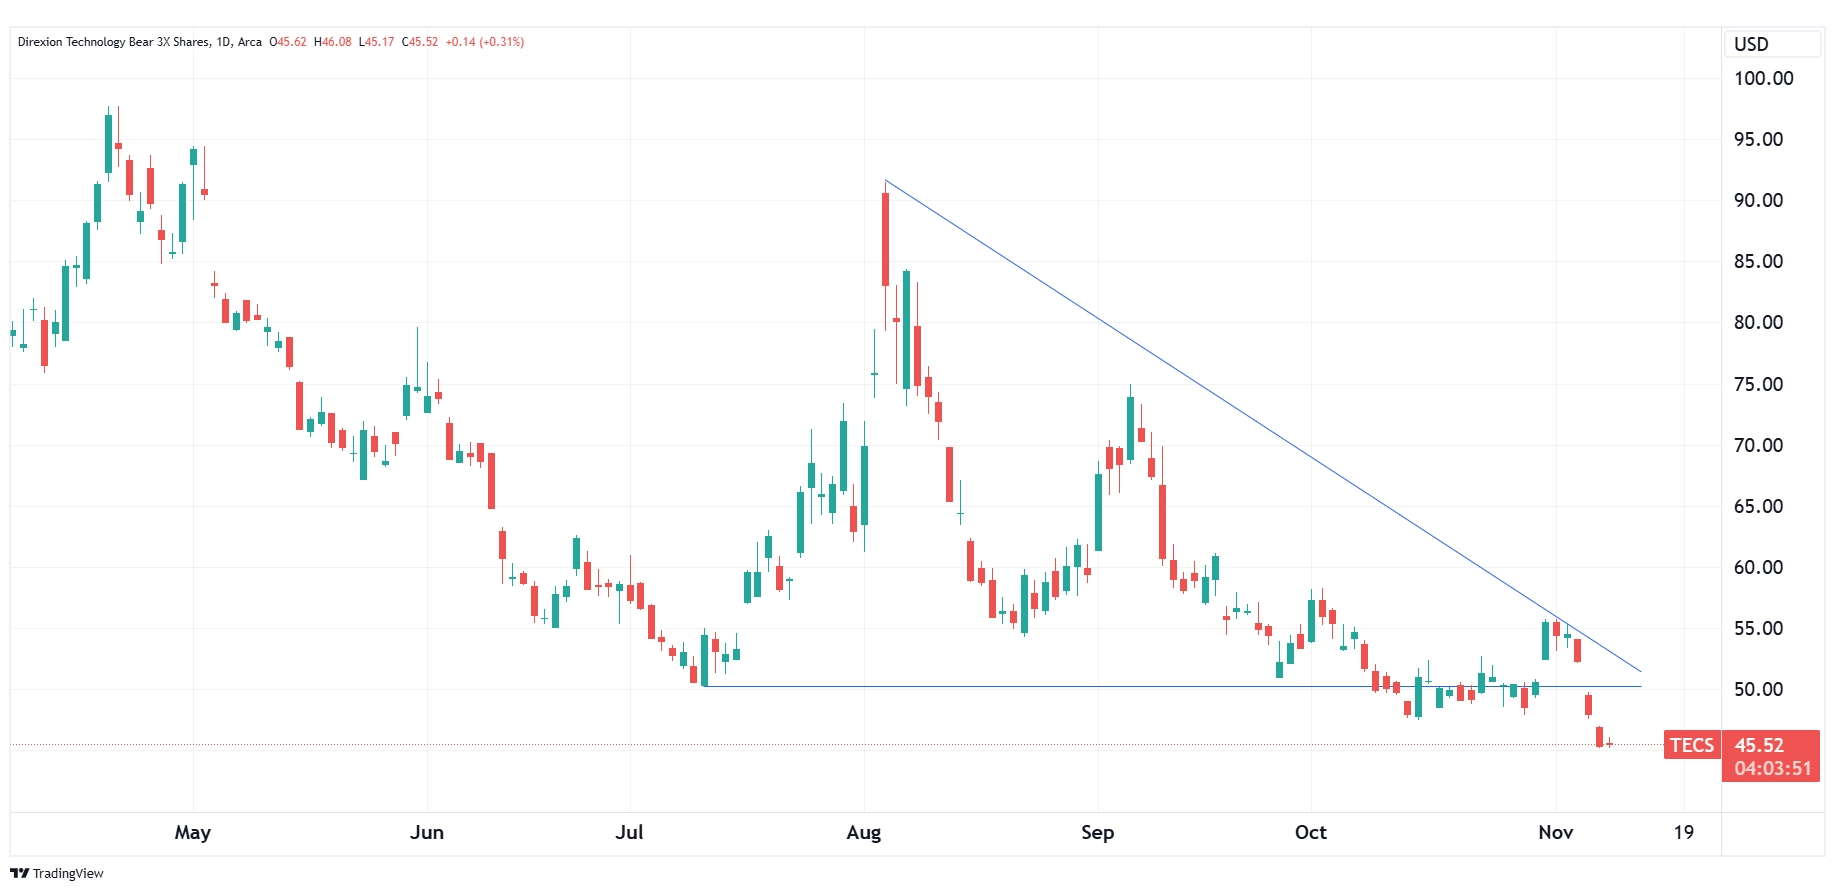
If long-term rates continue to rise, it would mean higher borrowing costs that could slow down investment in research and development (R&D), which could delay product launches and innovations. This could hurt prospects in the sector, but also open an opportunity with Direxion’s Daily Technology Bear 3X Shares (Ticker: TECS), which seeks daily investment results, before fees and expenses, of 300% of the inverse (or opposite) of the performance of the Technology Select Sector Index.
Below is a daily chart of TECS as of November 8, 2024.

Source: TradingView.com
Candlestick charts display the high and low (the stick) and the open and close price (the body) of a security for a specific period. If the body is filled, it means the close was lower than the open. If the body is empty, it means the close was higher than the open.
The performance data quoted represents past performance. Past performance does not guarantee future results. The investment return and principal value of an investment will fluctuate. An investor’s shares, when redeemed, may be worth more or less than their original cost; current performance may be lower or higher than the performance quoted. For the most recent month-end performance go to Direxion.com/etfs. For standardized performance click here.
Additional Tech Plays and Single-Stock Plays
Direxion offers traders additional thematic funds with leverage on both the bull and bear side of the market. Within the technology space, there are the Direxion Daily AI and Big Data Bull 2X Shares (Ticker: AIBU) and the Direxion Daily AI and Big Data Bear 2X Shares (Ticker: AIBD). These funds seek daily investment results, before fees and expenses, of 200%, or -200%, respectively, of the performance of the Solactive US AI & Big Data Index*.
There’s even the Direxion Daily Electric and Autonomous Vehicles Bull 2X Shares (Ticker: EVAV). This fund seeks daily investment results, before fees and expenses, of 200% of the performance of the Indxx US Electric and Autonomous Vehicles Index.
On the individual stock front, Direxion offers leveraged and inverse opportunities. Investing in the Fund is not equivalent to investing directly in the underlying stock and involves high degree of risk.
The Direxion Daily MSFT Bull 2X Shares (Ticker: MSFU) seeks daily investment results, before fees and expenses, of 200% of the performance of Microsoft Corporation common stock, while the Direxion Daily MSFT Bear 1X Shares (Ticker: MSFD) seeks daily investment results, before fees and expenses, of 100% of the inverse (or opposite) of Microsoft Corporation common stock.
The Direxion Daily META Bull 2X Shares (Ticker: METU) seeks daily investment results, before fees and expenses, of 200% of the performance of Meta Platforms, Inc. common stock, while the Direxion Daily META Bear 1X Shares (Ticker: METD) seeks daily investment results, before fees and expenses, of 100% of the inverse (or opposite) of the performance of Meta Platforms, Inc. common stock.
The Direxion Daily NVDA Bull 2X Shares (Ticker: NVDU) seeks daily investment results, before fees and expenses, of 200% of the performance of NVIDIA Corporation common stock, while the Direxion Daily NVDA Bear 1X Shares (Ticker: NVDD) seeks daily investment results, before fees and expenses, of 100% of the inverse (or opposite) of the performance of NVIDIA Corporation common stock.
*Definitions and Index Descriptions
An investor should carefully consider a Fund’s investment objective, risks, charges, and expenses before investing. A Fund’s prospectus and summary prospectus contain this and other information about the Direxion Shares. To obtain a Fund’s prospectus and summary prospectus call 866-476-7523 or visit our website at direxion.com. A Fund’s prospectus and summary prospectus should be read carefully before investing.
Leveraged and Inverse ETFs pursue daily leveraged investment objectives which means they are riskier than alternatives which do not use leverage. They seek daily goals and should not be expected to track the underlying index over periods longer than one day. They are not suitable for all investors and should be utilized only by sophisticated investors who understand leverage risk and who actively manage their investments.
The “Technology Select Sector Index” is a product of S&P Dow Jones Indices LLC (“SPDJI”), and has been licensed for use by Rafferty Asset Management, LLC (“Rafferty”). Standard & Poor’s® and S&P® are registered trademarks of Standard & Poor’s Financial Services LLC (“S&P”); Dow Jones® is a registered trademark of Dow Jones Trademark Holdings LLC (“Dow Jones”); and these trademarks have been licensed for use by SPDJI and sublicensed for certain purposes by Rafferty. Rafferty’s ETFs are not sponsored, endorsed, sold or promoted by SPDJI, Dow Jones, S&P, their respective affiliates and none of such parties make any representation regarding the advisability of investing in such product(s) nor do they have any liability for any errors, omissions, or interruptions of the Technology Select Sector Index.
The Technology Select Sector Index (IXTTR) is provided by S&P Dow Jones Indices and includes domestic companies from the technology sector which includes the following industries: computers and peripherals; software; diversified telecommunications services; communications equipment; semiconductors and semi-conductor equipment; internet software and services; IT services; electronic equipment, instruments and components; wireless telecommunication services; and office electronics.
The Solactive US AI & Big Data Index is designed by Solactive AG (the “Index Provider”) to represent the securities of companies from the United States that have business operations in the field of artificial intelligence (“AI”) applications and big data.
The Indxx US Electric and Autonomous Vehicles Index is designed to track the performance of electric and autonomous vehicles companies. The Index Provider defines electric and autonomous vehicles companies as those companies that derive at least 50% of their revenues from the following activities (or “sub-themes”): Manufacturers – companies that manufacture and sell electric or autonomous vehicles; Enablers – companies that build infrastructure or create technology for electric or autonomous vehicles, such as charging docks and batteries; and Software and Technology Services – companies that engage in the development of software and technology for electric or autonomous vehicles.
One cannot directly invest in an index.
Direxion Shares Risks – An investment in a Fund involves risk, including the possible loss of principal. A Fund is non-diversified and includes risks associated with the Fund’s concentrating its investments in a particular industry, sector, or geography which can increase volatility. The use of derivatives such as futures contracts and swaps are subject to market risks that may cause prices to fluctuate over time.
Leverage Risk – Each Fund obtains investment exposure in excess of its net assets by utilizing leverage and may lose more money in market conditions that are adverse to its investment objective than a fund that does not utilize leverage. A total loss may occur in a single day. Leverage will also have the effect of magnifying any differences in the Fund’s correlation or inverse correlation with the Index and may increase the volatility of the Fund.
Daily Index Correlation Risk – A number of factors may affect the Bull Fund’s ability to achieve a high degree of correlation with the Index and therefore achieve its daily leveraged investment objective. The Bull Fund’s exposure to the Index is impacted by the Index’s movement. Because of this, it is unlikely that the Bull Fund will be perfectly exposed to the Index at the end of each day. The possibility of the Bull Fund being materially over- or under-exposed to the Index increases on days when the Index is volatile near the close of the trading day.
Daily Inverse Index Correlation Risk – A number of factors may affect the Bear Fund’s ability to achieve a high degree of inverse correlation with the Index and therefore achieve its daily inverse leveraged investment objective. The Bear Fund’s exposure to the Index is impacted by the Index’s movement. Because of this, it is unlikely that the Bear Fund will be perfectly exposed to the Index at the end of each day. The possibility of the Bear Fund being materially over- or under-exposed to the Index increases on days when the Index is volatile near the close of the trading day.
Technology Sector Risk — The market prices of technology-related securities tend to exhibit a greater degree of market risk and sharp price fluctuations than other types of securities. These securities may fall in and out of favor with investors rapidly, which may cause sudden selling and dramatically lower market prices.
Additional risks of each Fund include Effects of Compounding and Market Volatility Risk, Market Risk, Counterparty Risk, Rebalancing Risk, Intra-Day Investment Risk, Other Investment Companies (including ETFs Risk), Cash Transaction Risk, Passive Investment and Index Performance Risk and for the Direxion Daily Technology Bear 3X Shares, Shorting or Inverse Risk. Please see the summary and full prospectuses for a more complete description of these and other risks of a Fund.