Magnificent or Overstretched? Mag 7 Faces an Uncertain Future
Editor's note: Any and all references to time frames longer than one trading day are for purposes of market context only, and not recommendations of any holding time frame. Daily rebalancing ETFs are not meant to be held unmonitored for long periods. If you don't have the resources, time or inclination to constantly monitor and manage your positions, leveraged and inverse ETFs are not for you.
The stock market is attempting to continue its long-term bull trend even as alarm bells surrounding the economy are growing. Much of the market’s appreciation over the past few years have come from the proverbial “Magnificent Seven,” which includes Amazon, Apple, Tesla, Alphabet, Microsoft, Nvidia, and Meta. Can the market continue to rely on this basket of stocks going forward, or have they become too big for their own good?
Are Earnings Enough to Drive Further Growth?
All of the companies in the Magnificent Seven have wrapped up their latest earnings reports, and the results have been good. None of them missed on earnings estimates – on the contrary, the results exceeded all analyst estimates.
These companies are critical to the broader stock market’s performance, as their combined market capitalization constitutes over 30% of the S&P 500*. In other words, the market needs these companies to continue growing revenue and earnings in order to justify higher prices. With the Fed set to start easing as soon as September, it could help the profit margins of these companies.
Traders that think the Magnificent Seven can continue driving market returns, especially to the upside, may find a position with Direxion’s Daily Magnificent 7 Bull 2X (Ticker: QQQU), which seeks daily investment results, before fees and expenses, of 200% of the performance of the Indxx Magnificent 7 Index*.
Below is a daily chart of QQQU as of August 29, 2024.
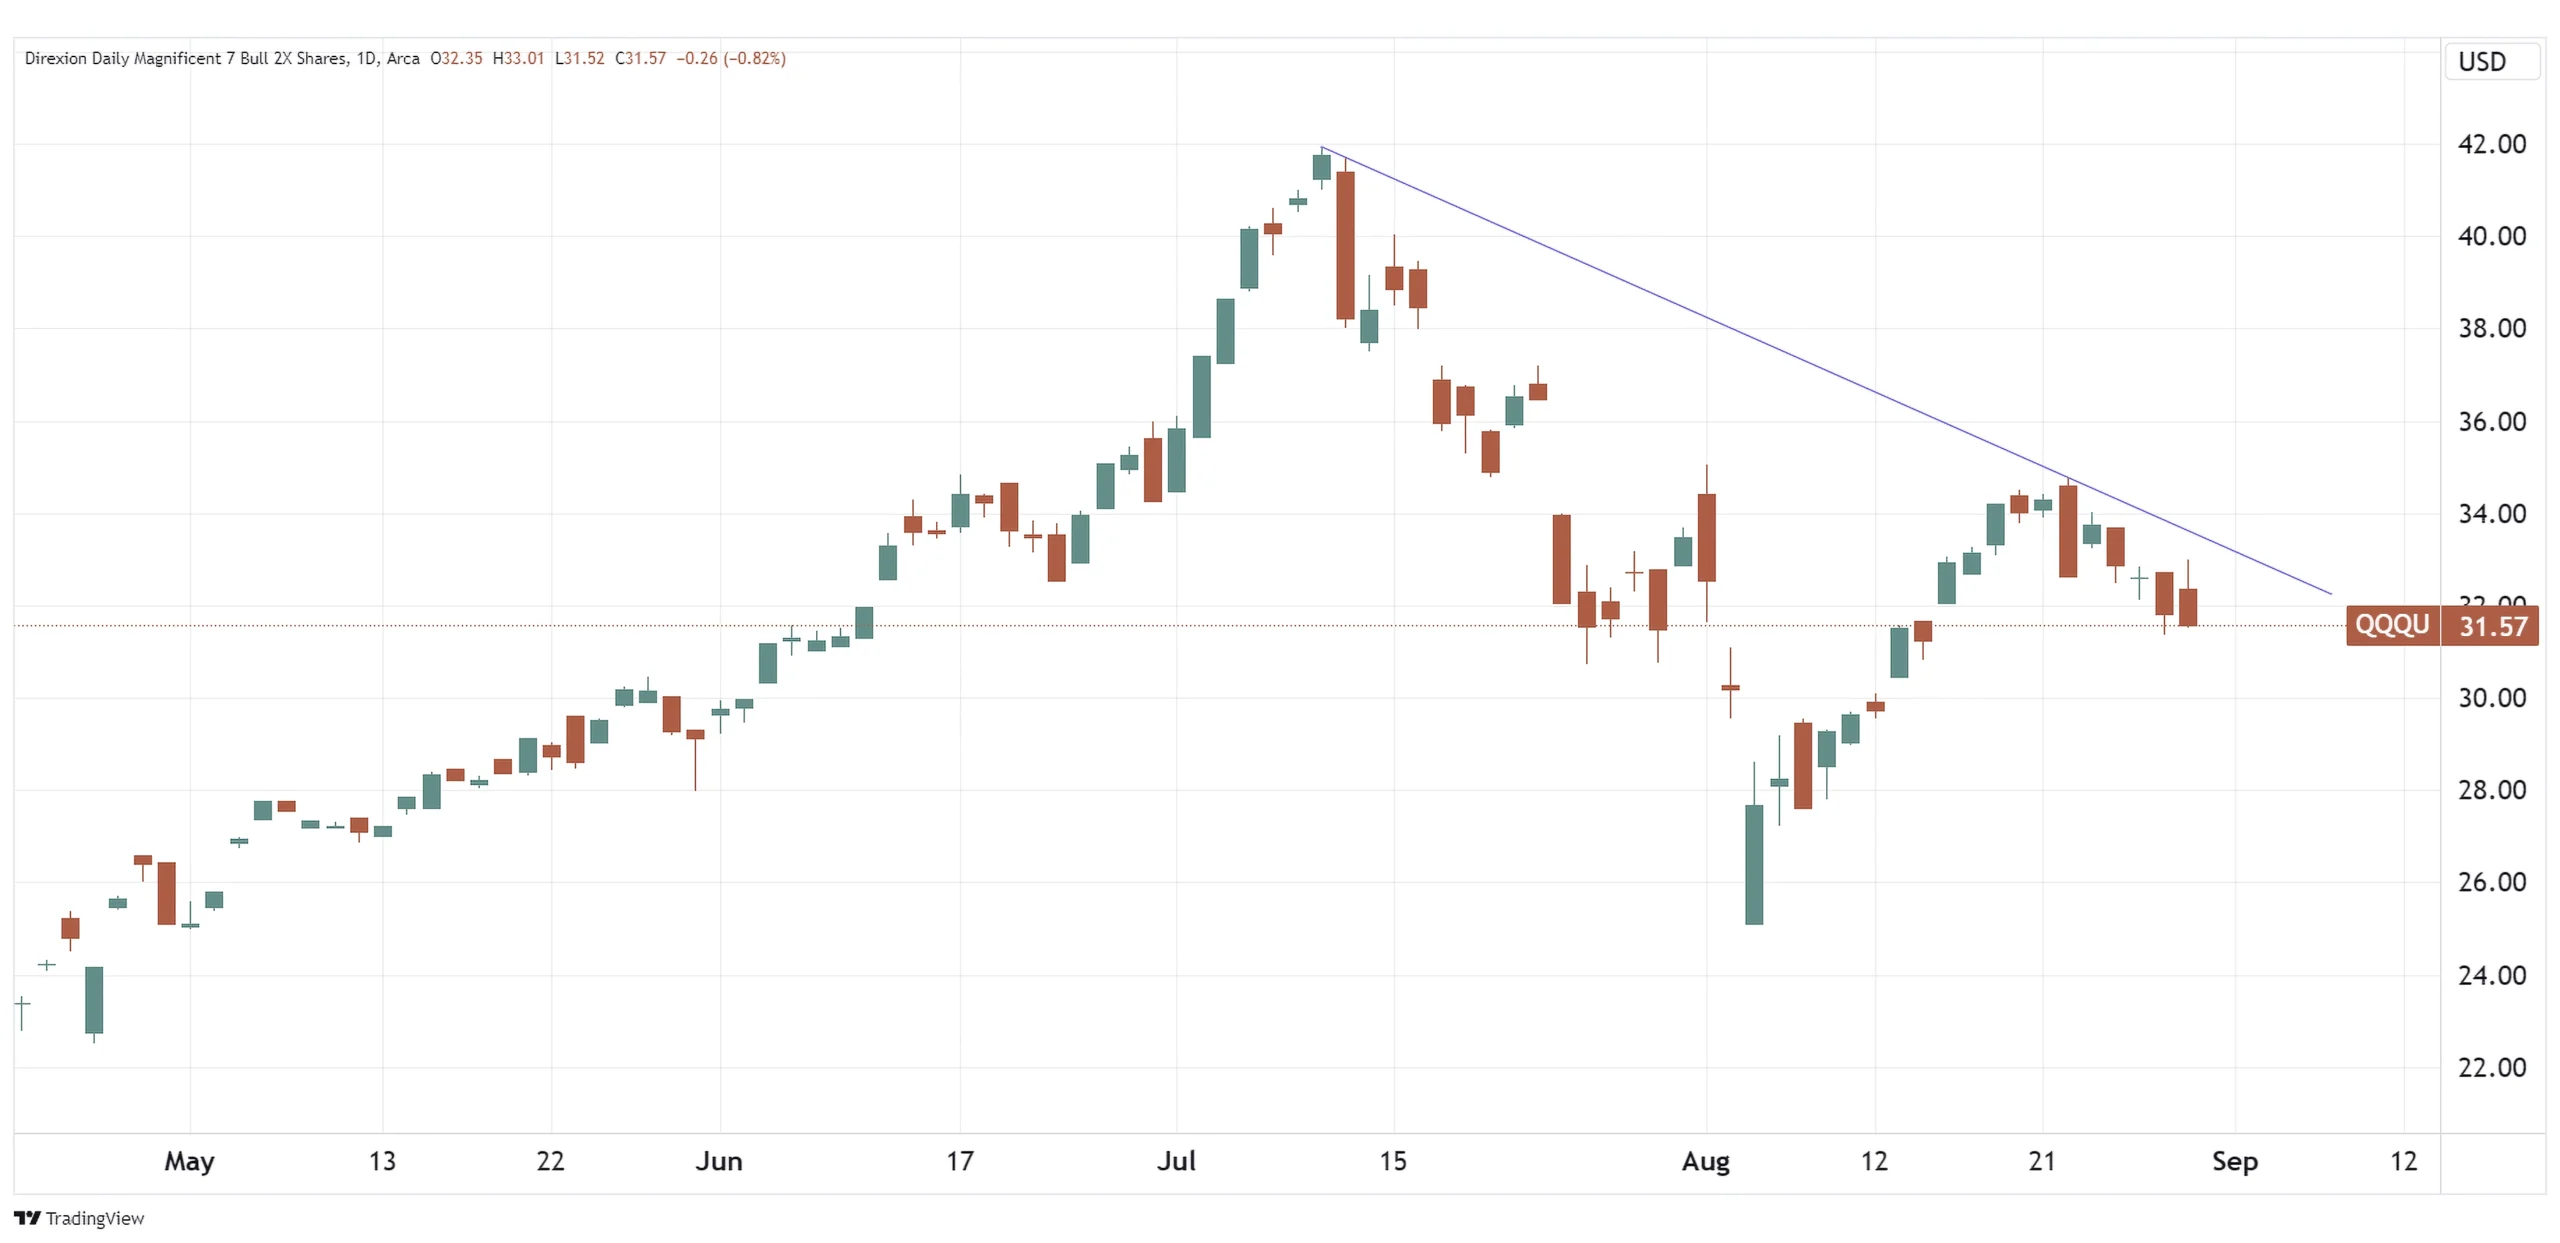
Source: TradingView.com
Candlestick charts display the high and low (the stick) and the open and close price (the body) of a security for a specific period. If the body is filled, it means the close was lower than the open. If the body is empty, it means the close was higher than the open.
The performance data quoted represents past performance. Past performance does not guarantee future results. The investment return and principal value of an investment will fluctuate. An investor’s shares, when redeemed, may be worth more or less than their original cost; current performance may be lower or higher than the performance quoted. For the most recent month-end performance go to Direxion.com/etfs. For standardized performance click here.
Could the Magnificent Seven Be More Exposed to a Slowdown?
The recently released Gross Domestic Product (GDP)* revision from the second quarter showed that the economy actually grew 3% instead of 2.8%. While this is an encouraging sign for the market, the Fed wouldn’t be set to lower interest rates in September if there weren’t concerns surrounding economic growth.
The next GDP release will be on September 26 . If we see a reading below 3%, it could signal an economic slowdown is approaching, which may hurt the performance of the Magnificent Seven basket.
In this scenario, Direxion’s Daily Magnificent 7 Bear 1X Shares (Ticker: QQQD), which seeks daily investment results, before fees and expenses, of 100% of the inverse (or opposite) of the performance of the Indxx Magnificent 7 Index could see a nice bid.
Below is a daily chart of QQQD as of August 29, 2024.
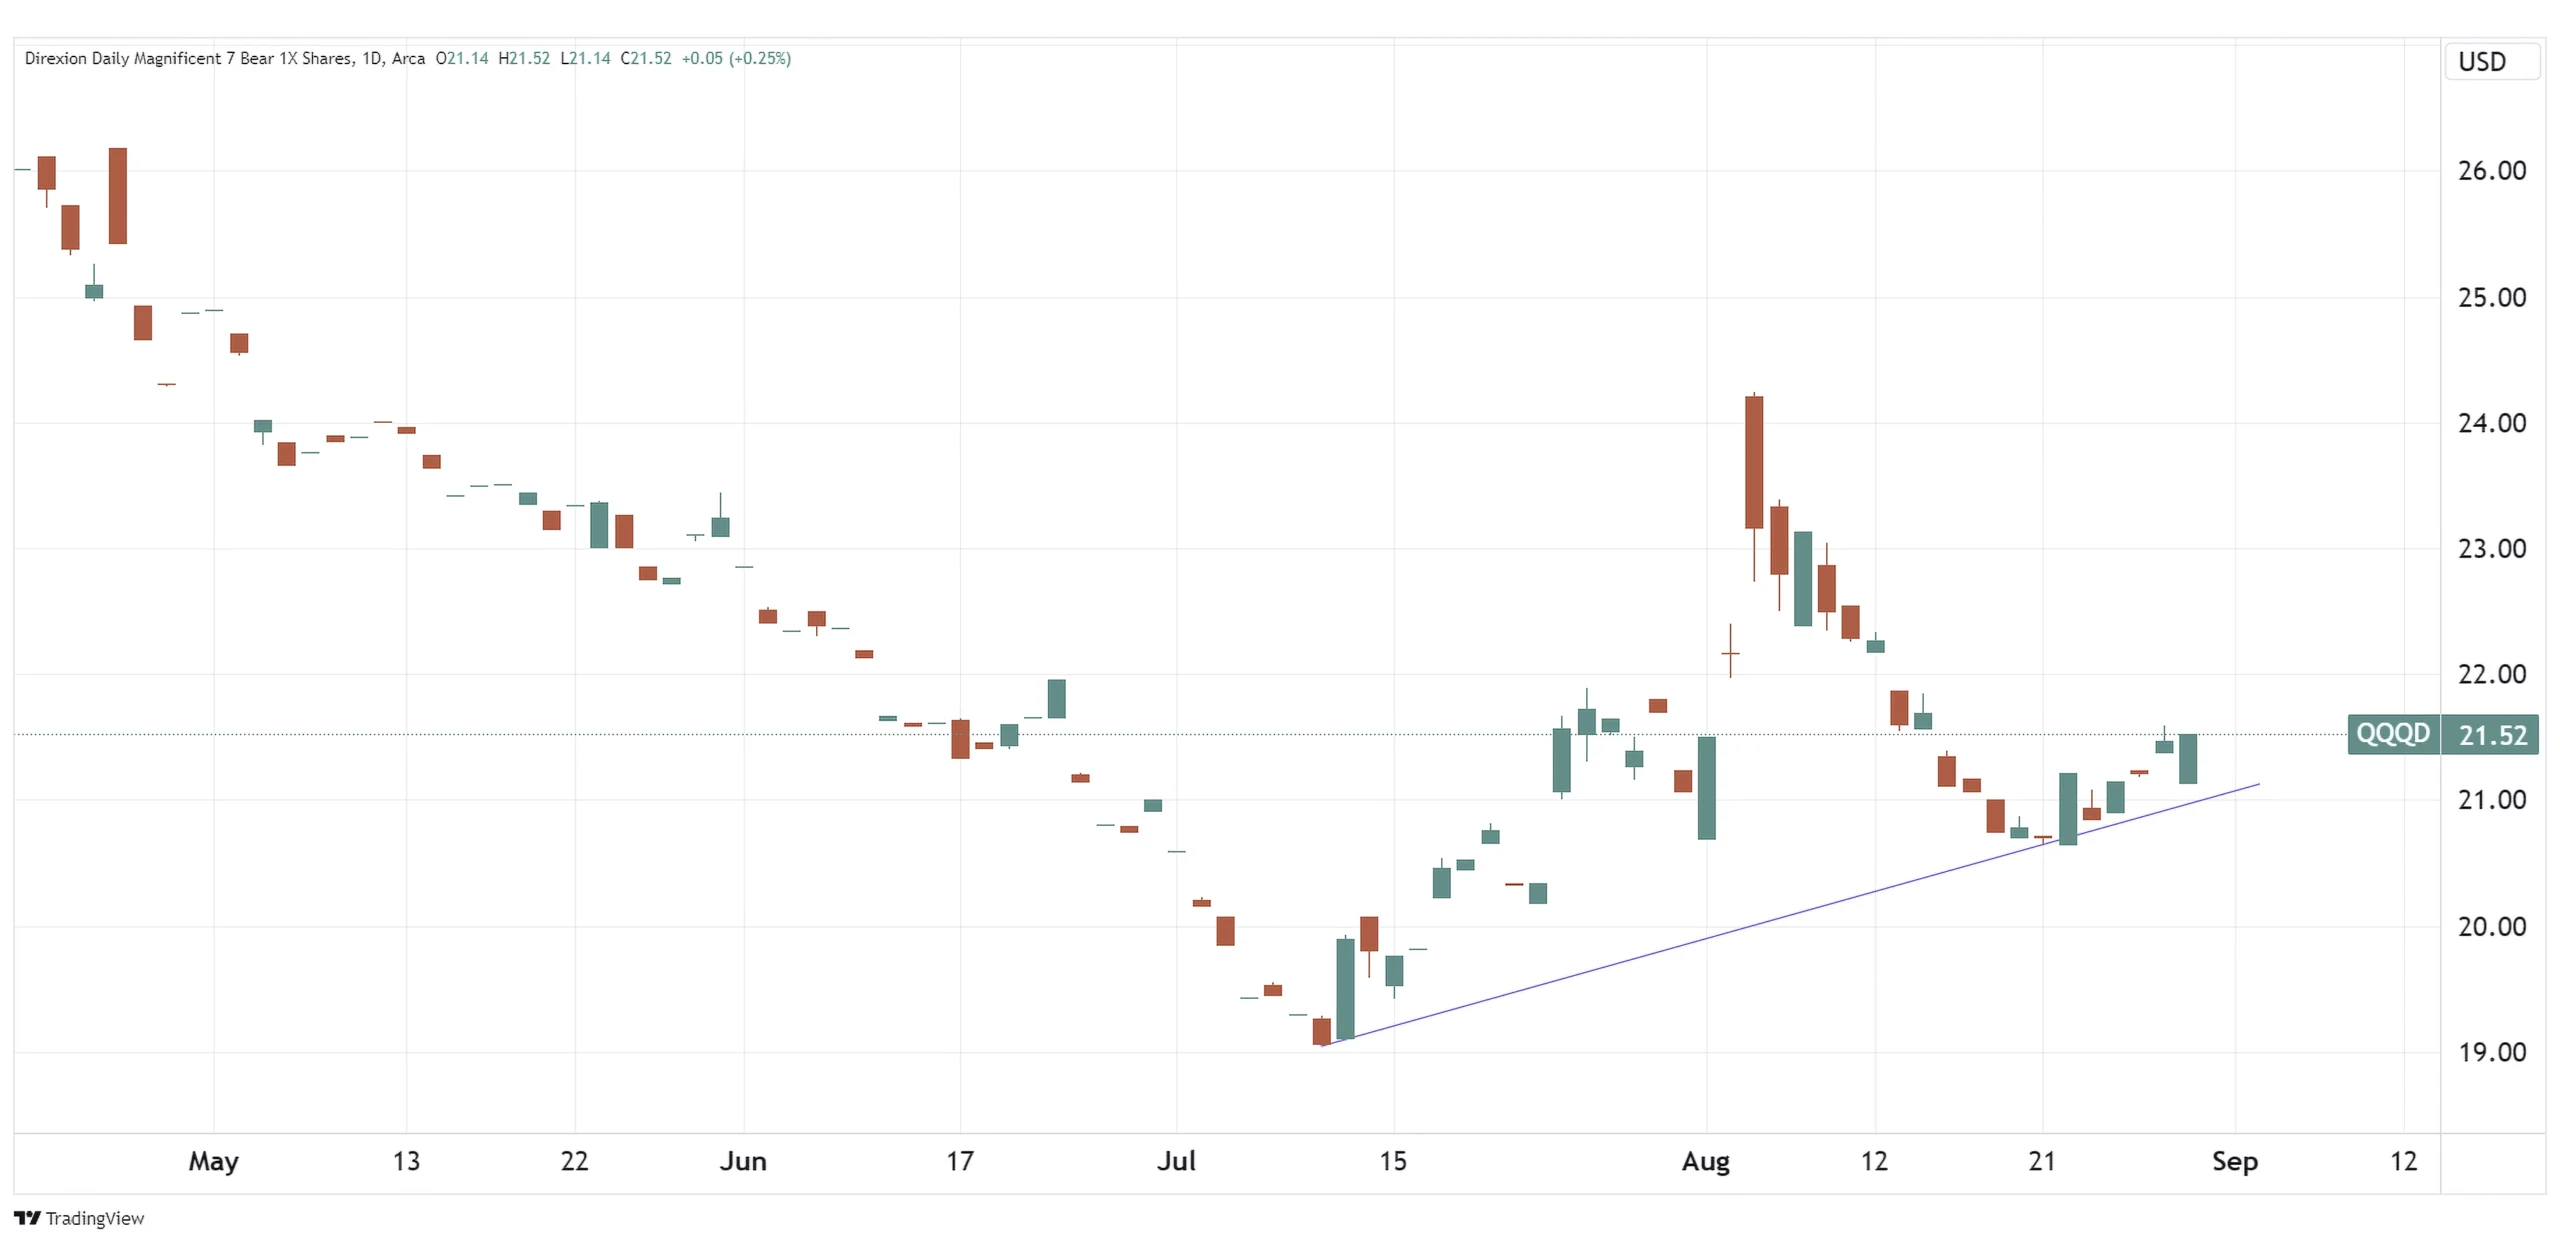
Source: TradingView.com
Candlestick charts display the high and low (the stick) and the open and close price (the body) of a security for a specific period. If the body is filled, it means the close was lower than the open. If the body is empty, it means the close was higher than the open.
The performance data quoted represents past performance. Past performance does not guarantee future results. The investment return and principal value of an investment will fluctuate. An investor’s shares, when redeemed, may be worth more or less than their original cost; current performance may be lower or higher than the performance quoted. For the most recent month-end performance go to Direxion.com/etfs. For standardized performance click here.
Play Magnificent Seven Names Individually
Direxion has spearheaded the individual ETF revolution by offering traders a way to trade individual members of the Magnificent Seven with leverage or inversely on an individual basis too. This provides trades a way to make concentrated bets on these market-moving names. Investing in the Funds is not equivalent to investing directly in the underlying stocks.
Direxion Daily AAPL Bull 2X Shares (Ticker: AAPU) seeks daily investment results, before fees and expenses, of 200% of the performance of Apple Inc. common stock, while the Direxion Daily AAPL Bear 1X Shares (Ticker: AAPD) seeks daily investment results, before fees and expenses, of 100% of the inverse (or opposite) of the performance of Apple Inc. common stock.
The Direxion Daily MSFT Bull 2X Shares (Ticker: MSFU) seeks daily investment results, before fees and expenses, of 200% of the performance of Microsoft Corporation common stock, while the Direxion Daily MSFT Bear 1X Shares (Ticker: MSFD) seeks daily investment results, before fees and expenses, of 100% of the inverse (or opposite) of Microsoft Corporation common stock.
The Direxion Daily META Bull 2X Shares (Ticker: METU) seeks daily investment results, before fees and expenses, of 200% of the performance of Meta Platforms, Inc. common stock, while the Direxion Daily META Bear 1X Shares (Ticker: METD) seeks daily investment results, before fees and expenses, of 100% of the inverse (or opposite) of the performance of Meta Platforms, Inc. common stock.
The Direxion Daily NVDA Bull 2X Shares (Ticker: NVDU) seeks daily investment results, before fees and expenses, of 200% of the performance of NVIDIA Corporation common stock, while the Direxion Daily NVDA Bear 1X Shares (Ticker: NVDD) seeks daily investment results, before fees and expenses, of 100% of the inverse (or opposite) of the performance of NVIDIA Corporation common stock.
The Direxion Daily AMZN Bull 2X Shares (Ticker: AMZU) seeks daily investment results, before fees and expenses, of 200% of the performance of Amazon.com, Inc. common stock, while the Direxion Daily AMZN Bear 1X Shares (Ticker: AMZD) seeks daily investment results, before fees and expenses, of 100% of the inverse (or opposite) of the performance of Amazon.com, Inc. common stock.
The Daily TSLA Bull 2X Shares (Ticker: TSLL) seeks daily investment results, before fees and expenses, of 200% of the performance of Tesla, Inc. common stock (Ticker: TSLA) before fees and expenses, while the Daily TSLA Bear 1X Shares (Ticker: TSLS) seeks daily investment results, before fees and expenses, of 100% of the inverse (or opposite) of the performance of Tesla, Inc. common stock.
The Daily GOOGL Bull 2X Shares (Ticker: GGLL) seeks daily investment results, before fees and expenses, of 200% of the performance of class A shares of Alphabet, Inc. (Ticker: GOOGL) before fees and expenses, while the Daily GOOGL Bear 1X Shares (Ticker: GGLS) seeks daily investment results, before fees and expenses, of 100% of the inverse (or opposite) of the performance of class A shares of Alphabet, Inc.
*Definitions and Index Descriptions
An investor should carefully consider a Fund’s investment objective, risks, charges, and expenses before investing. A Fund’s prospectus and summary prospectus contain this and other information about the Direxion Shares. To obtain a Fund’s prospectus and summary prospectus call 866-476-7523 or visit our website at direxion.com. A Fund’s prospectus and summary prospectus should be read carefully before investing.
Leveraged and Inverse ETFs pursue daily leveraged investment objectives which means they are riskier than alternatives which do not use leverage. They seek daily goals and should not be expected to track the underlying index over periods longer than one day. They are not suitable for all investors and should be utilized only by sophisticated investors who understand leverage risk and who actively manage their investments. The Indxx Magnificent 7 Index is provided by Indxx and is designed to track the performance of the seven largest NASDAQ listed companies.
The S&P 500® Index (SPXT) is designed to be comprised of stocks that are the 500 leading, large-cap U.S. listed issuers. The securities are selected on the basis of market capitalization, financial viability of the company, sector representation, public float, liquidity and price of a company’s shares outstanding. The Index is a float-adjusted, market capitalization-weighted index. One cannot directly invest in an index.
Direxion Shares Risks – An investment in a Fund involves risk, including the possible loss of principal. A Fund is non-diversified and includes risks associated with the Fund’s concentrating its investments in a particular industry, sector, or geography which can increase volatility. The use of derivatives such as futures contracts and swaps are subject to market risks that may cause prices to fluctuate over time.
Leverage Risk – The Bull Fund obtains investment exposure in excess of its net assets by utilizing leverage and may lose more money in market conditions that are adverse to its investment objective than a fund that does not utilize leverage. A total loss may occur in a single day. Leverage will also have the effect of magnifying any differences in the Fund’s correlation or inverse correlation with the Index and may increase the volatility of the Fund.
Daily Index Correlation Risk – A number of factors may affect the Bull Fund’s ability to achieve a high degree of correlation with the Index and therefore achieve its daily leveraged investment objective. The Bull Fund’s exposure to the Index is impacted by the Index’s movement. Because of this, it is unlikely that the Bull Fund will be perfectly exposed to the Index at the end of each day. The possibility of the Bull Fund being materially over- or under-exposed to the Index increases on days when the Index is volatile near the close of the trading day.
Daily Inverse Index Correlation Risk – A number of factors may affect the Bear Fund’s ability to achieve a high degree of inverse correlation with the Index and therefore achieve its daily inverse investment objective. The Bear Fund’s exposure to the Index is impacted by the Index’s movement. Because of this, it is unlikely that the Bear Fund will be perfectly exposed to the Index at the end of each day. The possibility of the Bear Fund being materially over- or under-exposed to the Index increases on days when the Index is volatile near the close of the trading day.
Information Technology Sector Risk — The value of stocks of information technology companies and companies that rely heavily on technology is particularly vulnerable to rapid changes in technology product cycles, rapid product obsolescence, government regulation, and competition, both domestically and internationally, including competition from competitors with lower production costs.
Additional risks of each Fund include Effects of Compounding and Market Volatility Risk, Market Risk, Counterparty Risk, Rebalancing Risk, Intra-Day Investment Risk, Other Investment Companies (including ETFs Risk), Cash Transaction Risk, Passive Investment and Index Performance Risk and for the Direxion Daily Magnificent 7 Bear 1X Shares, Shorting or Inverse Risk. Please see the summary and full prospectuses for a more complete description of these and other risks of a Fund.