
Editor's note: Any and all references to time frames longer than one trading day are for purposes of market context only, and not recommendations of any holding time frame. Daily rebalancing ETFs are not meant to be held unmonitored for long periods. If you don't have the resources, time or inclination to constantly monitor and manage your positions, leveraged and inverse ETFs are not for you.
The Federal Reserve opted to keep interest rates unchanged following the most recent Federal Open Market Committee (FOMC) meeting despite the evidence of inflationary pressures being contained for months now. Central banks across the world including the Bank of Canada, the European Central Bank, the Swiss National Bank, and most recently, the Bank of England, have all begun to lower interest rates. Is the Fed falling behind the curve? Will they be bigger than expected? And if so, is this presenting a tradable opportunity in Treasury markets?
Flight-to-Safety Acceleration
After last week’s FOMC meeting, Fed Chair Powell signaled that rate cuts could be coming. But it seems like markets are front-running the central bank’s potential rate cut on the long-end of the yield curve.
Inflation* numbers have come down significantly, and just last week, the July unemployment report showed some concerning figures that significantly bolster the probability of rate cuts as soon as September.
While some may cheer the prospects of further liquidity on the horizon, it also signals that the economy is slowing, and that a recession could be approaching. Historically, long-term Treasuries have performed well as a safe-haven asset.
Traders that are concerned about the prospects of an economic slowdown may find an opportunity with Direxion’s Daily 20+ Year Treasury Bull 3X Shares (Ticker: TMF), which seeks daily investment results, before fees and expenses, of 300% of the performance of the ICE U.S. Treasury 20+ Year Bond Index*.
Below is a daily chart of TMF as of August 1, 2024.
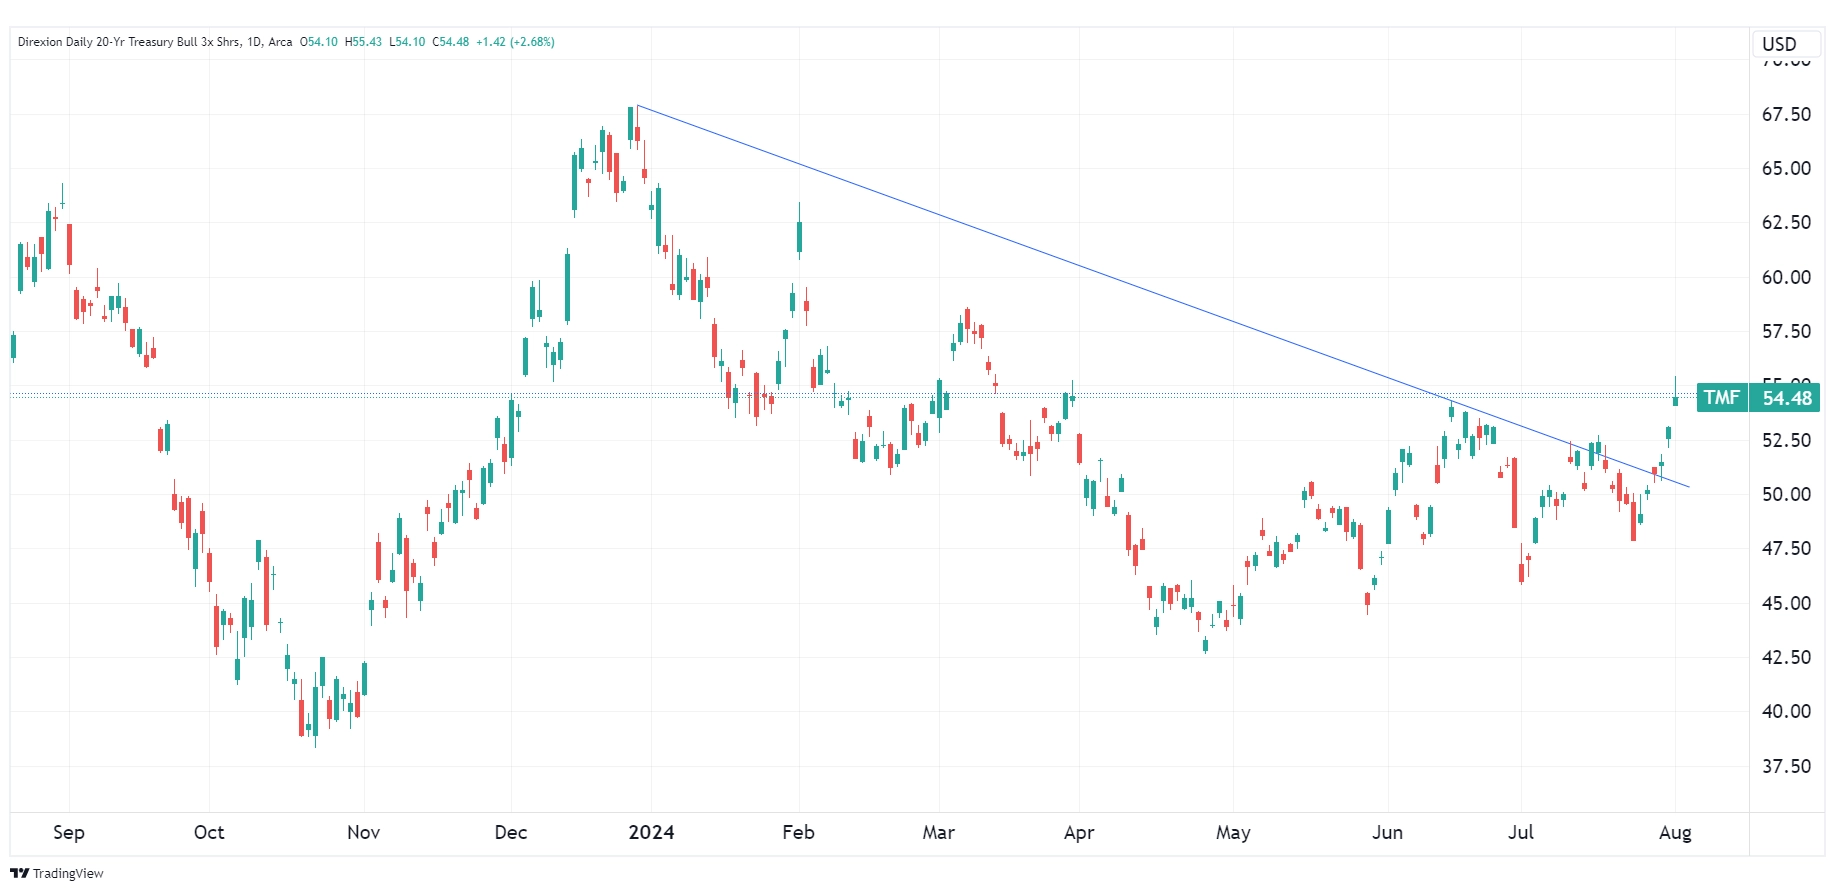
Source: TradingView.com
Candlestick charts display the high and low (the stick) and the open and close price (the body) of a security for a specific period. If the body is filled, it means the close was lower than the open. If the body is empty, it means the close was higher than the open.
The performance data quoted represents past performance. Past performance does not guarantee future results. The investment return and principal value of an investment will fluctuate. An investor’s shares, when redeemed, may be worth more or less than their original cost; current performance may be lower or higher than the performance quoted. For the most recent month-end performance go to Direxion.com/etfs. For standardized performance click here.
The slanted blue line represents a downtrend. A downtrend describes the price movement of a financial asset when the overall direction is downward.
Could Rate Cuts Trigger More Inflation?
The other factor to consider if and when the Federal Reserve starts cutting rates is whether it will begin adding back to the money supply. After seemingly taming the inflationary beast, traders must keep a close watch on whether another round of rate cuts could stimulate an increase in prices.
The next inflation report is set to be released on August 14, and it will cover the month of July on a monthly and annual basis. If price pressures start increasing again, it may cause the Fed to think twice about rate cuts, and could cause a rout in Treasury markets.
In this scenario, Direxion’s Daily 20+ Year Treasury Bear 3X Shares (Ticker: TMV), which seeks daily investment results, before fees and expenses, of 300% of the inverse (or opposite) of the performance of the ICE U.S. 20+ Year Bond Index could provide a potential opportunity.
Below is a daily chart of TMV as of August 1, 2024.
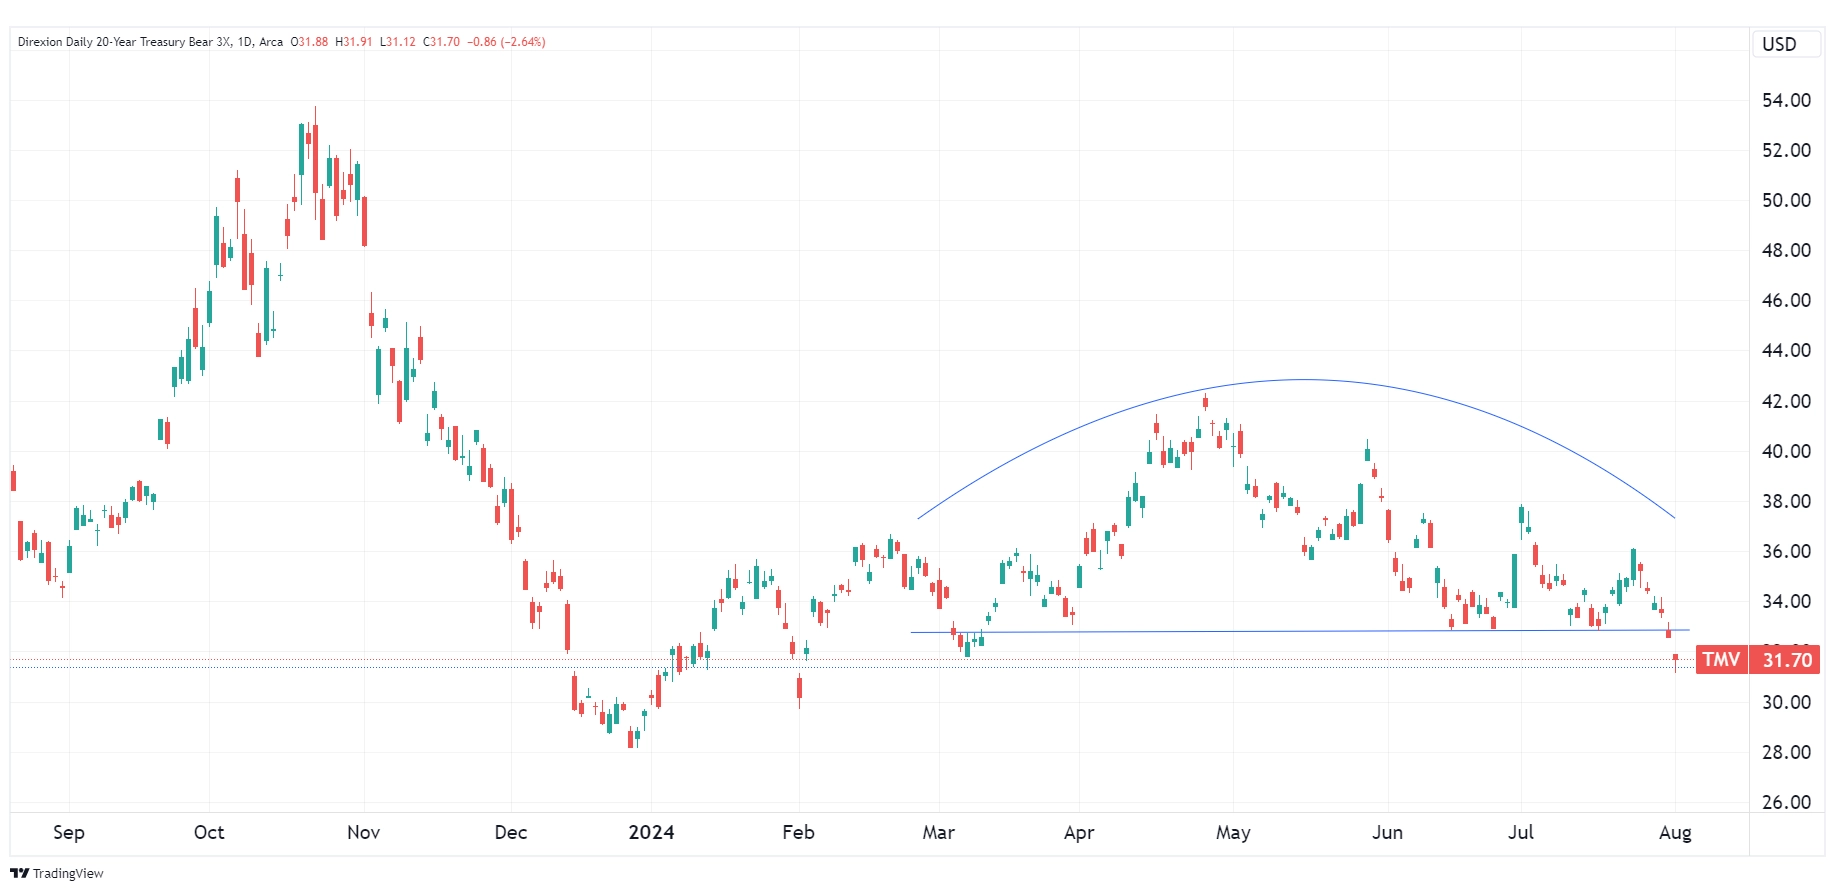
Source: TradingView.com
Candlestick charts display the high and low (the stick) and the open and close price (the body) of a security for a specific period. If the body is filled, it means the close was lower than the open. If the body is empty, it means the close was higher than the open.
The performance data quoted represents past performance. Past performance does not guarantee future results. The investment return and principal value of an investment will fluctuate. An investor’s shares, when redeemed, may be worth more or less than their original cost; current performance may be lower or higher than the performance quoted. For the most recent month-end performance go to Direxion.com/etfs. For standardized performance click here.
The blue lines represent an uptrend and/or downtrend. An uptrend describes the price movement of a financial asset when the overall direction is upward. A downtrend describes the price movement of a financial asset when the overall direction is downward.
Additional Trade and Hedge Opportunities
Traders seeking additional trade opportunities may consider the Direxion Daily Junior Gold Miners Index Bull 2X Shares (Ticker: JNUG) or the Direxion Daily Junior Gold Miners Index Bear 2X Shares (Ticker: JDST), which seeks daily investment results, before fees and expenses, of 200%, or -200%, respectively, of the performance of the MVIS Global Junior Gold Miners Index*.
Those that wish to stick with the equity market, and potentially even seek hedges via the equity indices may consider the Direxion Daily S&P 500 Bull 3X (Ticker: SPXL) or the Direxion Daily S&P 500 Bear 3X (Ticker: SPXS), which seeks daily investment results, before fees and expenses, of 300%, or -300%, respectively, of the performance of the S&P 500 Index*.
*Definitions and Index Descriptions
An investor should carefully consider a Fund’s investment objective, risks, charges, and expenses before investing. A Fund’s prospectus and summary prospectus contain this and other information about the Direxion Shares. To obtain a Fund’s prospectus and summary prospectus call 866-476-7523 or visit our website at direxion.com. A Fund’s prospectus and summary prospectus should be read carefully before investing.
Leveraged and Inverse ETFs pursue daily leveraged investment objectives which means they are riskier than alternatives which do not use leverage. They seek daily goals and should not be expected to track the underlying index over periods longer than one day. They are not suitable for all investors and should be utilized only by sophisticated investors who understand leverage risk and who actively manage their investments.
The ICE U.S. Treasury 20+ Year Bond Index (IDCOT20TR) is a market value weighted index that includes publicly issued U.S. Treasury securities that have a remaining maturity of greater than 20 years. Eligible securities must be fixed rate, denominated in U.S. dollars, and have $300 million or more of outstanding face value, excluding amounts held by the Federal Reserve. Securities excluded from the Index are inflation-linked securities, Treasury bills, cash management bills, any government agency debt issued with or without a government guarantee and zero-coupon issues that have been stripped from coupon-paying bonds.
The MVIS Global Junior Gold Miners Index (MVGDXJTR) tracks the performance of foreign and domestic micro-, small- and mid-capitalization companies that generate, or demonstrate the potential to generate, at least 50% of their revenues from, or have at least 50% of their assets related to, gold mining and/or silver mining, hold real property or have mining projects that have the potential to produce at least 50% of the company’s revenue from gold or silver mining when developed, or primarily invest in gold or silver.
The S&P 500® Index (SPXT) is designed to be comprised of stocks that are the 500 leading, large-cap U.S. listed issuers. The securities are selected on the basis of market capitalization, financial viability of the company, sector representation, public float, liquidity and price of a company’s shares outstanding. The Index is a float-adjusted, market capitalization-weighted index.
One cannot directly invest in an index.
Neither Rafferty nor the Direxion Daily 20+ Year Treasury Bull 3X Shares and the Direxion Daily 20+ Year Treasury Bear 3X Shares (the “Financial Products”) is sponsored, endorsed, sold or promoted by Interactive Data Pricing and Reference Data, LLC or its affiliates (“Vendor”). Vendor makes no representation or warranty regarding the advisability of investing in securities generally, in the Financial Products particularly, or the ability of the ICE U.S. Treasury 20+ Year Bond Index to track general financial market performance. VENDOR MAKES NO EXPRESS OR IMPLIED WARRANTIES, AND HEREBY EXPRESSLY DISCLAIMS ALL WARRANTIES OF MERCHANTABILITY OR FITNESS FOR A PARTICULAR PURPOSE WITH RESPECT TO THE ICE INDEX OR ANY DATA INCLUDED THEREIN. IN NO EVENT SHALL VENDOR HAVE ANY LIABILITY FOR ANY SPECIAL, PUNITIVE, INDIRECT, OR CONSEQUENTIAL DAMAGES (INCLUDING LOST PROFITS), EVEN IF NOTIFIED OF THE POSSIBILITY OF SUCH DAMAGES.
Direxion Shares Risks – An investment in each Fund involves risk, including the possible loss of principal. Each Fund is non-diversified and includes risks associated with the Funds’ concentrating their investments in a particular industry, sector, or geographic region which can result in increased volatility. The use of derivatives such as futures contracts and swaps are subject to market risks that may cause their price to fluctuate over time. Risks of each Fund include Effects of Compounding and Market Volatility Risk, Leverage Risk, Market Risk, Aggressive Investment Techniques Risk, Counterparty Risk, Intra-Day Investment Risk, Other Investment Companies (including ETFs) Risk, Cash Transaction Risk, Passive Investment and Index Performance Risk, and risks specific to U.S. Government securities. Additional risks include, for the Direxion Daily 20+ Year Treasury Bull 3X Shares, Daily Index Correlation Risk, and for the Direxion Daily 20+ Year Treasury Bear 3X Shares, Shorting or Inverse Risk and Daily Inverse Index Correlation Risk. A security backed by the U.S. Treasury or the full faith and credit of the United States is guaranteed only as to the timely payment of interest and principal when held to maturity. The market prices for such securities are not guaranteed and will fluctuate. Please see the summary and full prospectuses for a more complete description of these and other risks of each Fund.