Aggressive Treasury Plays: Betting on September Fed Rate Cut
Editor's note: Any and all references to time frames longer than one trading day are for purposes of market context only, and not recommendations of any holding time frame. Daily rebalancing ETFs are not meant to be held unmonitored for long periods. If you don't have the resources, time or inclination to constantly monitor and manage your positions, leveraged and inverse ETFs are not for you.
Yields on 10-year U.S. Treasuries have trended lower lately with bond markets pricing in a Federal Reserve rate cut as early as September. Aside from the usual Fed speculation, add in some extra uncertainty for the U.S. presidential election and interest rate traders may see some action in coming weeks and months.
The closely watched 10-year yield is still above 4% after blasting higher from a low of around 0.6% in 2020. Interest rates may be approaching a key crossroads with bond traders pricing in a greater than 90% likelihood that the Fed will cut by a quarter point at the September 17–18 meeting, according to CME FedWatch as of July 17.
The central bank has been on pause after hiking rates in 2022 and 2023 in one of the sharpest tightening cycles in its history. The federal funds rate is currently in the range of 5.25% to 5.50%, the highest level in over 20 years.
Below is a daily chart of the 10-year U.S. Treasury yield as of July 16, 2024.
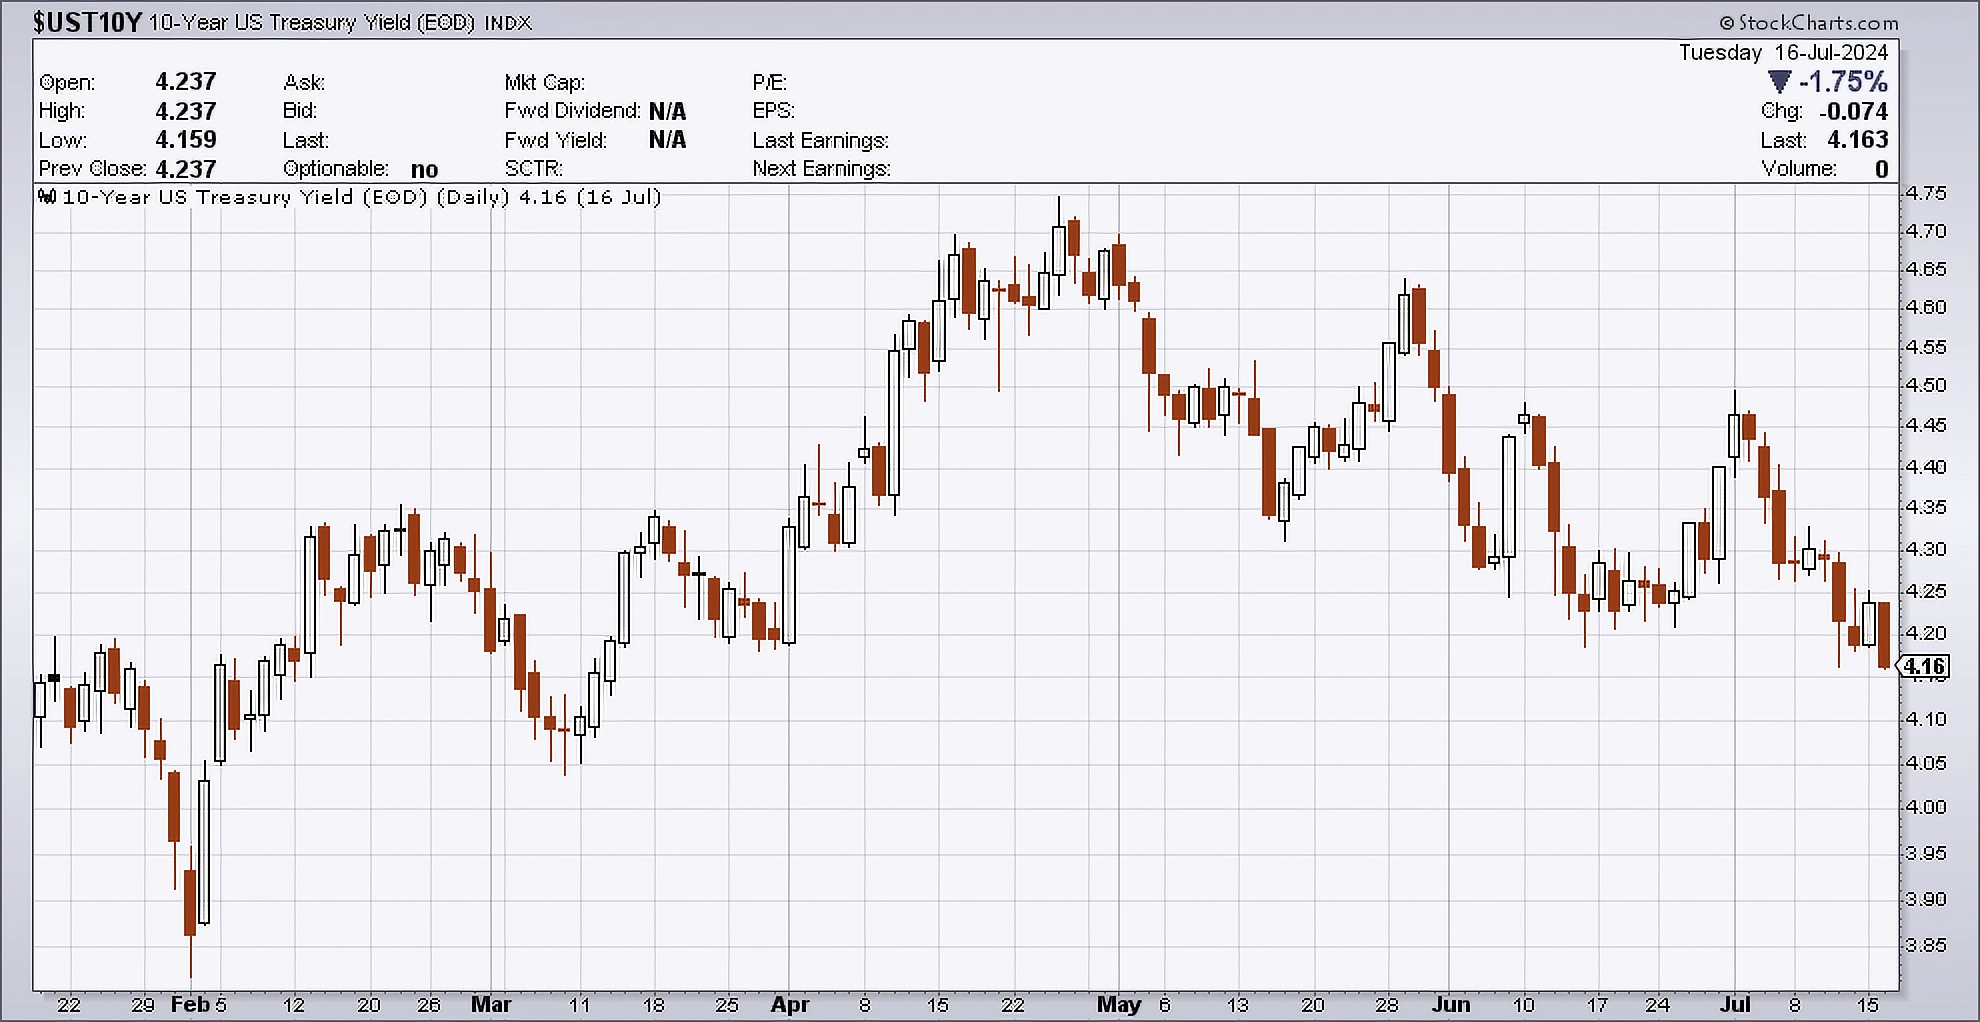
Source: StockCharts.com, July 16, 2024.
Candlestick charts display the high and low (the stick) and the open and close price (the body) of a security for a specific period. If the body is filled, it means the close was lower than the open. If the body is empty, it means the close was higher than the open.
The performance data quoted represents past performance. Past performance does not guarantee future results.
What to Watch in Treasury Bonds
Jerome Powell and the Fed are pretty much in the driver’s seat when it comes to the outlook for rates for the rest of 2024. For the July 30–31 meeting, traders will look for any hints that the Fed will proceed with a cut at the September meeting as the market currently expects. Powell will hold a press conference after the July policy announcement.
Speaking before Congress in early July, Fed chief Powell said the U.S. economy was no longer overheated amid signs the job market was also cooling off, Reuters reports. It was a subtle shift in tone that was interpreted as the Fed being more open to cutting rates.
According to the June Consumer Price Index (CPI)* report, the 12-month rate for inflation fell to 3%, the lowest level in over three years, CNBC reported. The July CPI print is expected to cross on August 14, according to the Department of Labor. If inflation* continues to moderate, it could give more cover for the Fed to cut rates.
There are other strong crosscurrents that could impact Treasuries in coming weeks. Although rates have risen along with inflation, any signs of weakness in the economy could quickly switch the narrative to deflation fears and falling rates. The next monthly U.S. employment report is expected to cross on August 2, according to FXStreet.
Then there is the U.S. presidential election and the possibility that uncertainty may drive demand for traditional safe-haven assets like U.S. Treasuries. When it comes to politics, though, trying to guess the outcome of recent presidential elections—and how markets react—has been a fool’s errand.
Leveraged ETFs for U.S. Treasuries
Traders looking to play the long end of the Treasury curve with leverage may consider the Direxion Daily 20+ Year Treasury Bull 3X Shares (Ticker: TMF) and the Direxion Daily 20+ Year Treasury Bear 3X Shares (Ticker: TMV), which seek daily investment results, before fees and expenses, of 300%, or -300%, respectively, of the daily performance of the ICE U.S. Treasury 20+ Year Bond Index.*
Traders more interested in the middle of the curve might consider the Direxion Daily 7-10 Year Treasury Bull 3X Shares (Ticker: TYD) or the Direxion Daily 7-10 Year Treasury Bear 3X Shares (Ticker: TYO), which seek daily investment results, before fees and expenses, of 300%, or -300%, respectively, of the performance of the ICE U.S. Treasury 7-10 Year Bond Index*.
*Definitions and Index Descriptions
An investor should carefully consider a Fund’s investment objective, risks, charges, and expenses before investing. A Fund’s prospectus and summary prospectus contain this and other information about the Direxion Shares. To obtain a Fund’s prospectus and summary prospectus call 866-476-7523 or visit our website at www.direxion.com. A Fund’s prospectus and summary prospectus should be read carefully before investing.
Leveraged and Inverse ETFs pursue daily leveraged investment objectives which means they are riskier than alternatives which do not use leverage. They seek daily goals and should not be expected to track the underlying index over periods longer than one day. They are not suitable for all investors and should be utilized only by sophisticated investors who understand leverage risk and who actively manage their investments.
The ICE U.S. Treasury 20+ Year Bond Index (IDCOT20TR) is a market value weighted index that includes publicly issued U.S. Treasury securities that have a remaining maturity of greater than 20 years. Eligible securities must be fixed rate, denominated in U.S. dollars, and have $300 million or more of outstanding face value, excluding amounts held by the Federal Reserve. Securities excluded from the Index are inflation-linked securities, Treasury bills, cash management bills, any government agency debt issued with or without a government guarantee and zero-coupon issues that have been stripped from coupon-paying bonds.
The ICE U.S. Treasury 7-10 Year Bond Index (IDCOT7TR) is a market value weighted index that includes publicly issued U.S. Treasury securities that have a remaining maturity of greater than seven years and less than or equal to ten years. Eligible securities must be fixed rate, denominated in U.S. dollars, and have $300 million or more of outstanding face value, excluding amounts held by the Federal Reserve. Securities excluded from the Index are inflation-linked securities, Treasury bills, cash management bills, any government agency debt issued with or without a government guarantee and zero-coupon issues that have been stripped from coupon-paying bonds.
One cannot directly invest in an index.
Neither Rafferty nor the Direxion Daily 7-10 Year Treasury Bull 3X Shares, Direxion Daily 7-10 Year Treasury Bear 3X Shares, Direxion Daily 20+ Year Treasury Bull 3X Shares or Direxion Daily 20+ Year Treasury Bear 3X Shares (the “Financial Products”) are sponsored, endorsed, sold or promoted by Interactive Data Pricing and Reference Data, LLC or its affiliates (“Vendor”). Vendor makes no representation or warranty regarding the advisability of investing in securities generally, in the Financial Products particularly, or the ability of the ICE U.S. Treasury 7-10 Year Bond Index or ICE U.S. Treasury 20+ Year Bond Index to track general financial market performance. VENDOR MAKES NO EXPRESS OR IMPLIED WARRANTIES, AND HEREBY EXPRESSLY DISCLAIMS ALL WARRANTIES OF MERCHANTABILITY OR FITNESS FOR A PARTICULAR PURPOSE WITH RESPECT TO THE ICE INDICES OR ANY DATA INCLUDED THEREIN. IN NO EVENT SHALL VENDOR HAVE ANY LIABILITY FOR ANY SPECIAL, PUNITIVE, INDIRECT, OR CONSEQUENTIAL DAMAGES (INCLUDING LOST PROFITS), EVEN IF NOTIFIED OF THE POSSIBILITY OF SUCH DAMAGES.
Direxion Shares Risks – An investment in each Fund involves risk, including the possible loss of principal. Each Fund is non-diversified and includes risks associated with the Funds’ concentrating their investments in a particular industry, sector, or geographic region which can result in increased volatility. The use of derivatives such as futures contracts and swaps are subject to market risks that may cause their price to fluctuate over time. Risks of each Fund include Effects of Compounding and Market Volatility Risk, Leverage Risk, Market Risk, Aggressive Investment Techniques Risk, Counterparty Risk, Intra-Day Investment Risk, Other Investment Companies (including ETFs) Risk, Cash Transaction Risk, Tax Risk, and risks specific to U.S. Government Securities. Additional risks include, for the Direxion Daily 20+ Year Bull 3X Shares, Daily Index Correlation Risk, and for the Direxion Daily 20+ Year Treasury Bear 3X Shares, Daily Inverse Index Correlation Risk, and risks related to Shorting. A security backed by the U.S. Treasury or the full faith and credit of the United States is guaranteed only as to the timely payment of interest and principal when held to maturity. The market prices for such securities are not guaranteed and will fluctuate. Please see the summary and full prospectuses for a more complete description of these and other risks of each Fund.