
Editor's note: Any and all references to time frames longer than one trading day are for purposes of market context only, and not recommendations of any holding time frame. Daily rebalancing ETFs are not meant to be held unmonitored for long periods. If you don't have the resources, time or inclination to constantly monitor and manage your positions, leveraged and inverse ETFs are not for you.
Stock markets have staged an impressive rebound year-to-date, with many of last year’s worst-performing sectors leading the way. This all comes off the back of inflation numbers coming in lower-than-expected, and Q4 GDP reports coming in better-than-expected. In response, the Federal Reserve has slowed the pace of rate hikes notably, which has given markets a bit of breathing room with respect to liquidity.
High-beta stocks have performed well since October’s lows. Could this be the start of a more sustained trend? Or was it simply a short-covering frenzy?
From Worst, To Best
High-beta stocks are characterized by their positive and amplified correlation with the broader market. In other words, we can expect high-beta stocks to outperform to the upside, as well as on the downside in whatever direction the market is moving.
In a risk-on equity environment, traders with a greater risk appetite may choose to allocate to high-flying names with the intention of outperforming the index. The recent macro trends of stabilizing inflation, a strong labor market, and solid economic growth are all staples of a risk-on environment, which is good for high-beta stocks.
Traders looking to ride the equity market’s wave of upside momentum may find an opportunity in Direxion’s Daily S&P 500® High Beta Bull 3X Shares (Ticker: HIBL), which seeks daily investment results, before fees and expenses, of 300% of the performance of the S&P 500® High Beta Index*.
The fund’s top holdings as of December 31, 2022, include names like Etsy (Ticker: ETSY)(1.70%), NVIDIA (Ticker: NVDA) (1.56%), and Advanced Micro Devices (Ticker: AMD) (1.48%). Etsy is set to report its Q4 2022 earnings on February 23. Analysts are looking for an earnings-per-share (EPS) of $0.81. Nvidia is poised to report its earnings for fiscal-year Q1 on February 22. Analyst estimates are for an EPS of $0.48. Advanced Micro Devices already reported its Q4 earnings, and beat estimates of $0.52 by reporting $0.54 EPS. Traders that favor the bullish outlook for high-beta stocks may choose to follow the upcoming earnings for ETSY and NVDA.
Below is a daily chart of HIBL as of February 5, 2023.
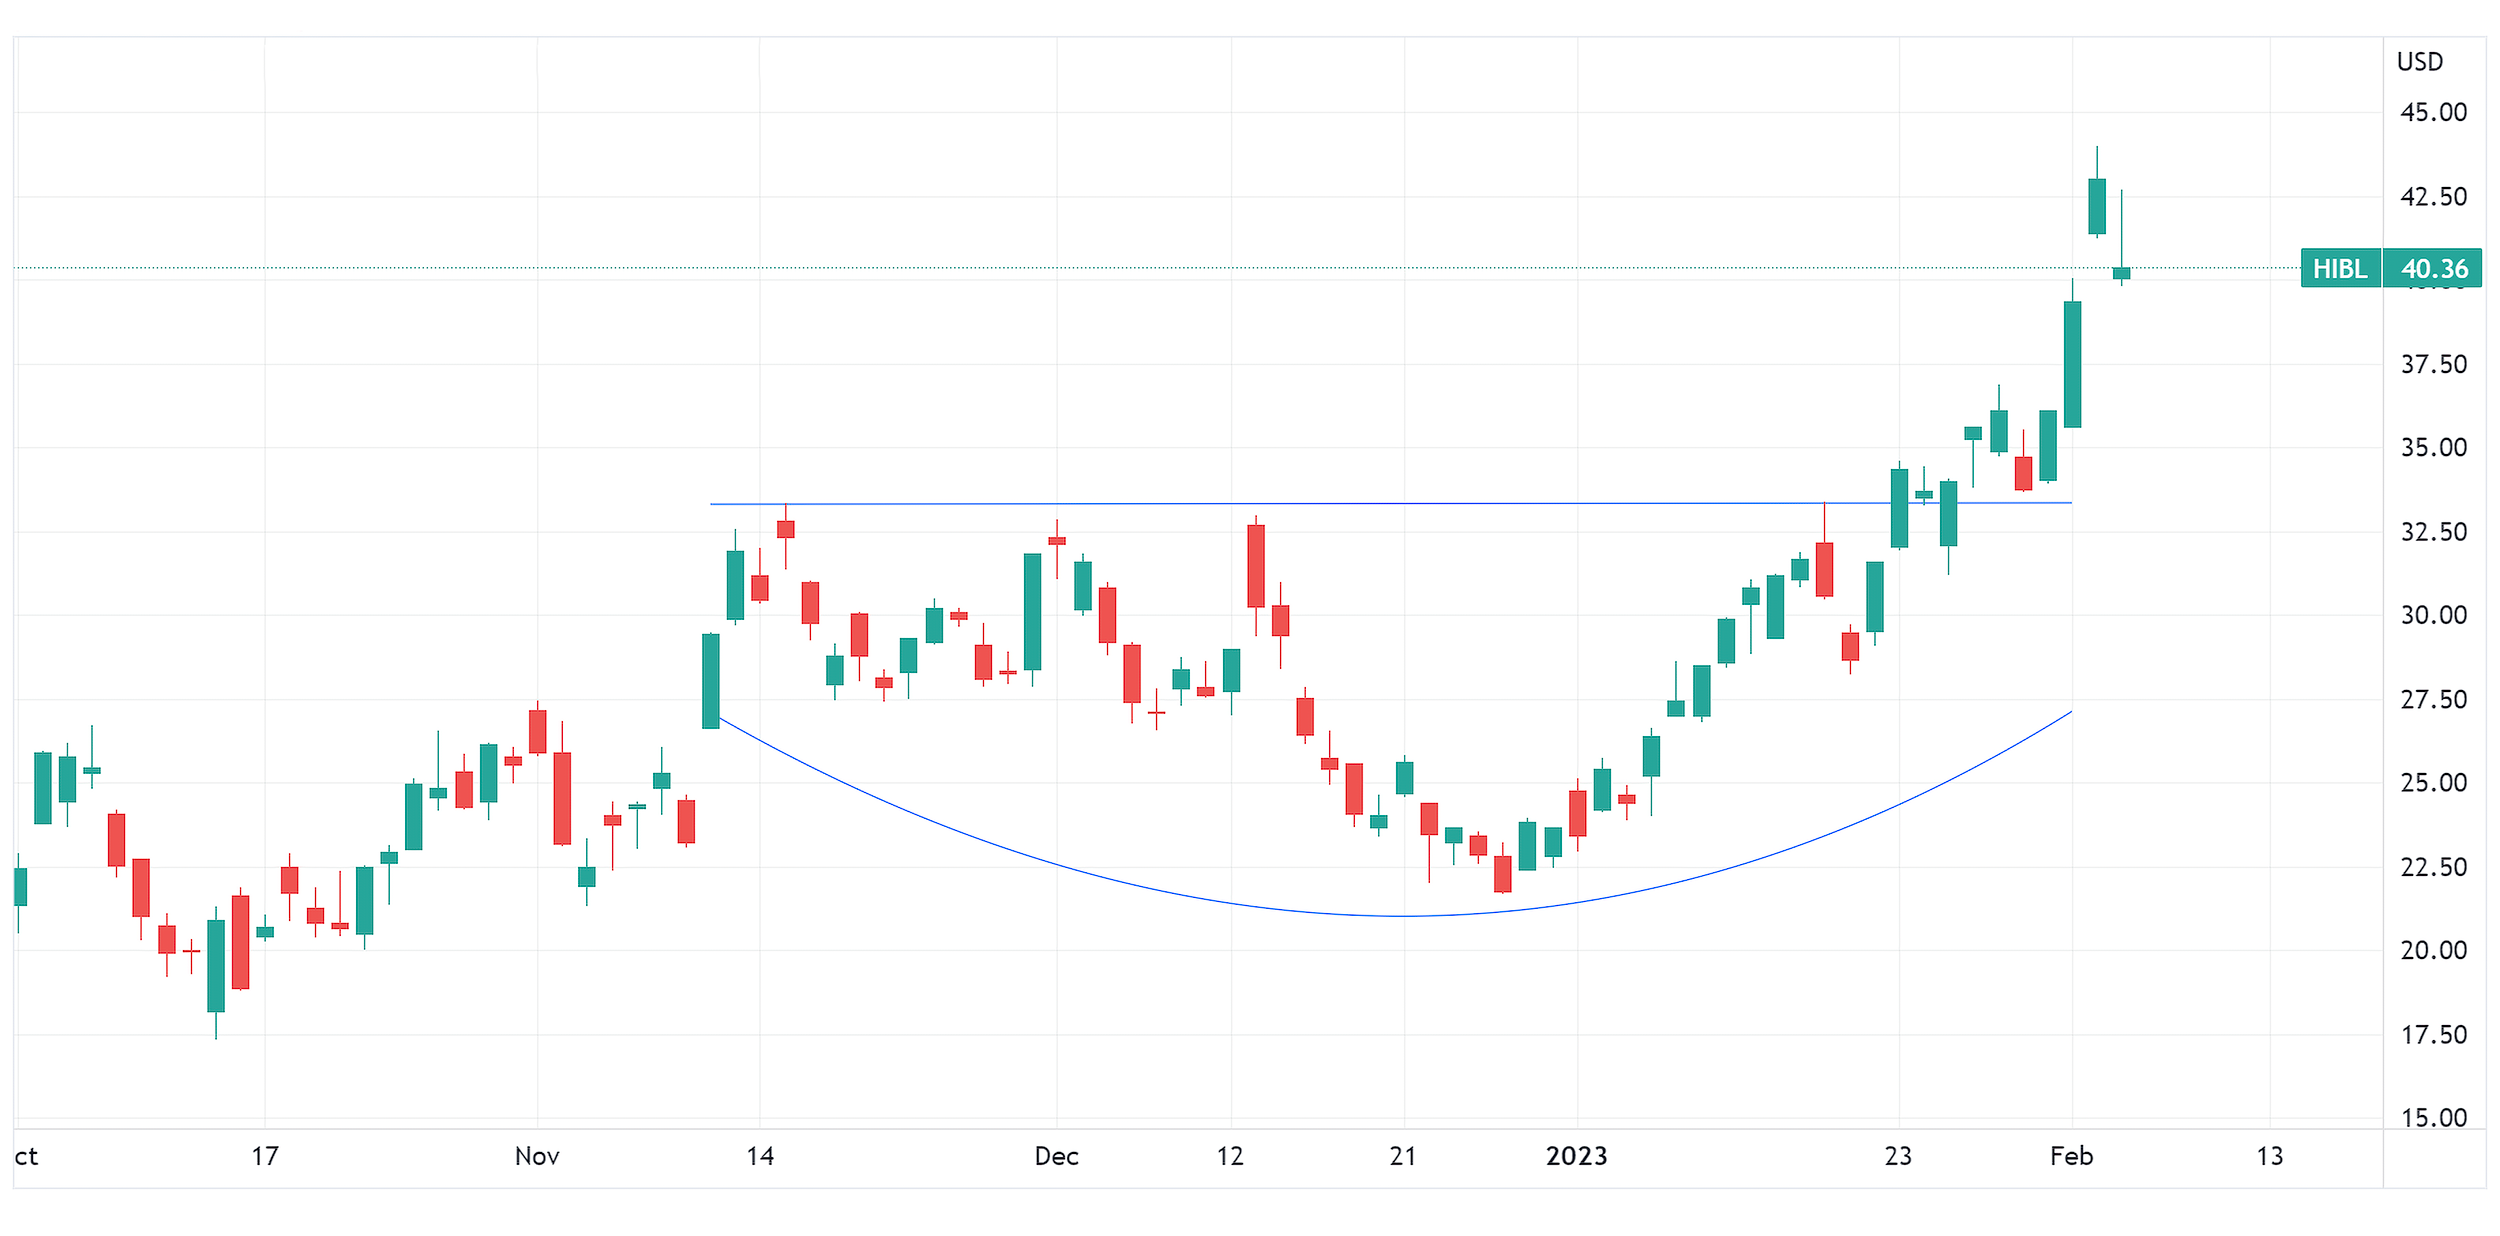
Source: TradingView.com
Candlestick charts display the high and low (the stick) and the open and close price (the body) of a security for a specific period. If the body is filled, it means the close was lower than the open. If the body is empty, it means the close was higher than the open.
The performance data quoted represents past performance. Past performance does not guarantee future results. The investment return and principal value of an investment will fluctuate. An investor’s shares, when redeemed, may be worth more or less than their original cost; current performance may be lower or higher than the performance quoted. For the most recent month-end performance go to Direxion.com/etfs. For standardized performance click here.
Mean Reversion Imminent?
One of the costliest emotions in the world of speculation is FOMO (fear of missing out). Those who still favor the bearish outlook for equities in the near-term would likely characterize the recent rally as a mere case of short-covering. Short squeezes are notorious for producing big gains in short periods of time.
Stock market bears could point to the strong jobs market as a further cause for the Fed to continue draining market liquidity. If so, high-beta stocks could see their recent fortunes quickly reverse, and recommence a bearish trend.
Traders looking to capitalize on a potential bearish outlook for high-beta stocks may consider Direxion’s Daily S&P 500® High Beta Bear 3X Shares (Ticker: HIBS), which seeks daily investment results, before fees and expenses, of 300% of the inverse (or opposite), of the performance of the S&P 500® High Beta Index.
Below is a daily chart of HIBS as of February 5, 2023.
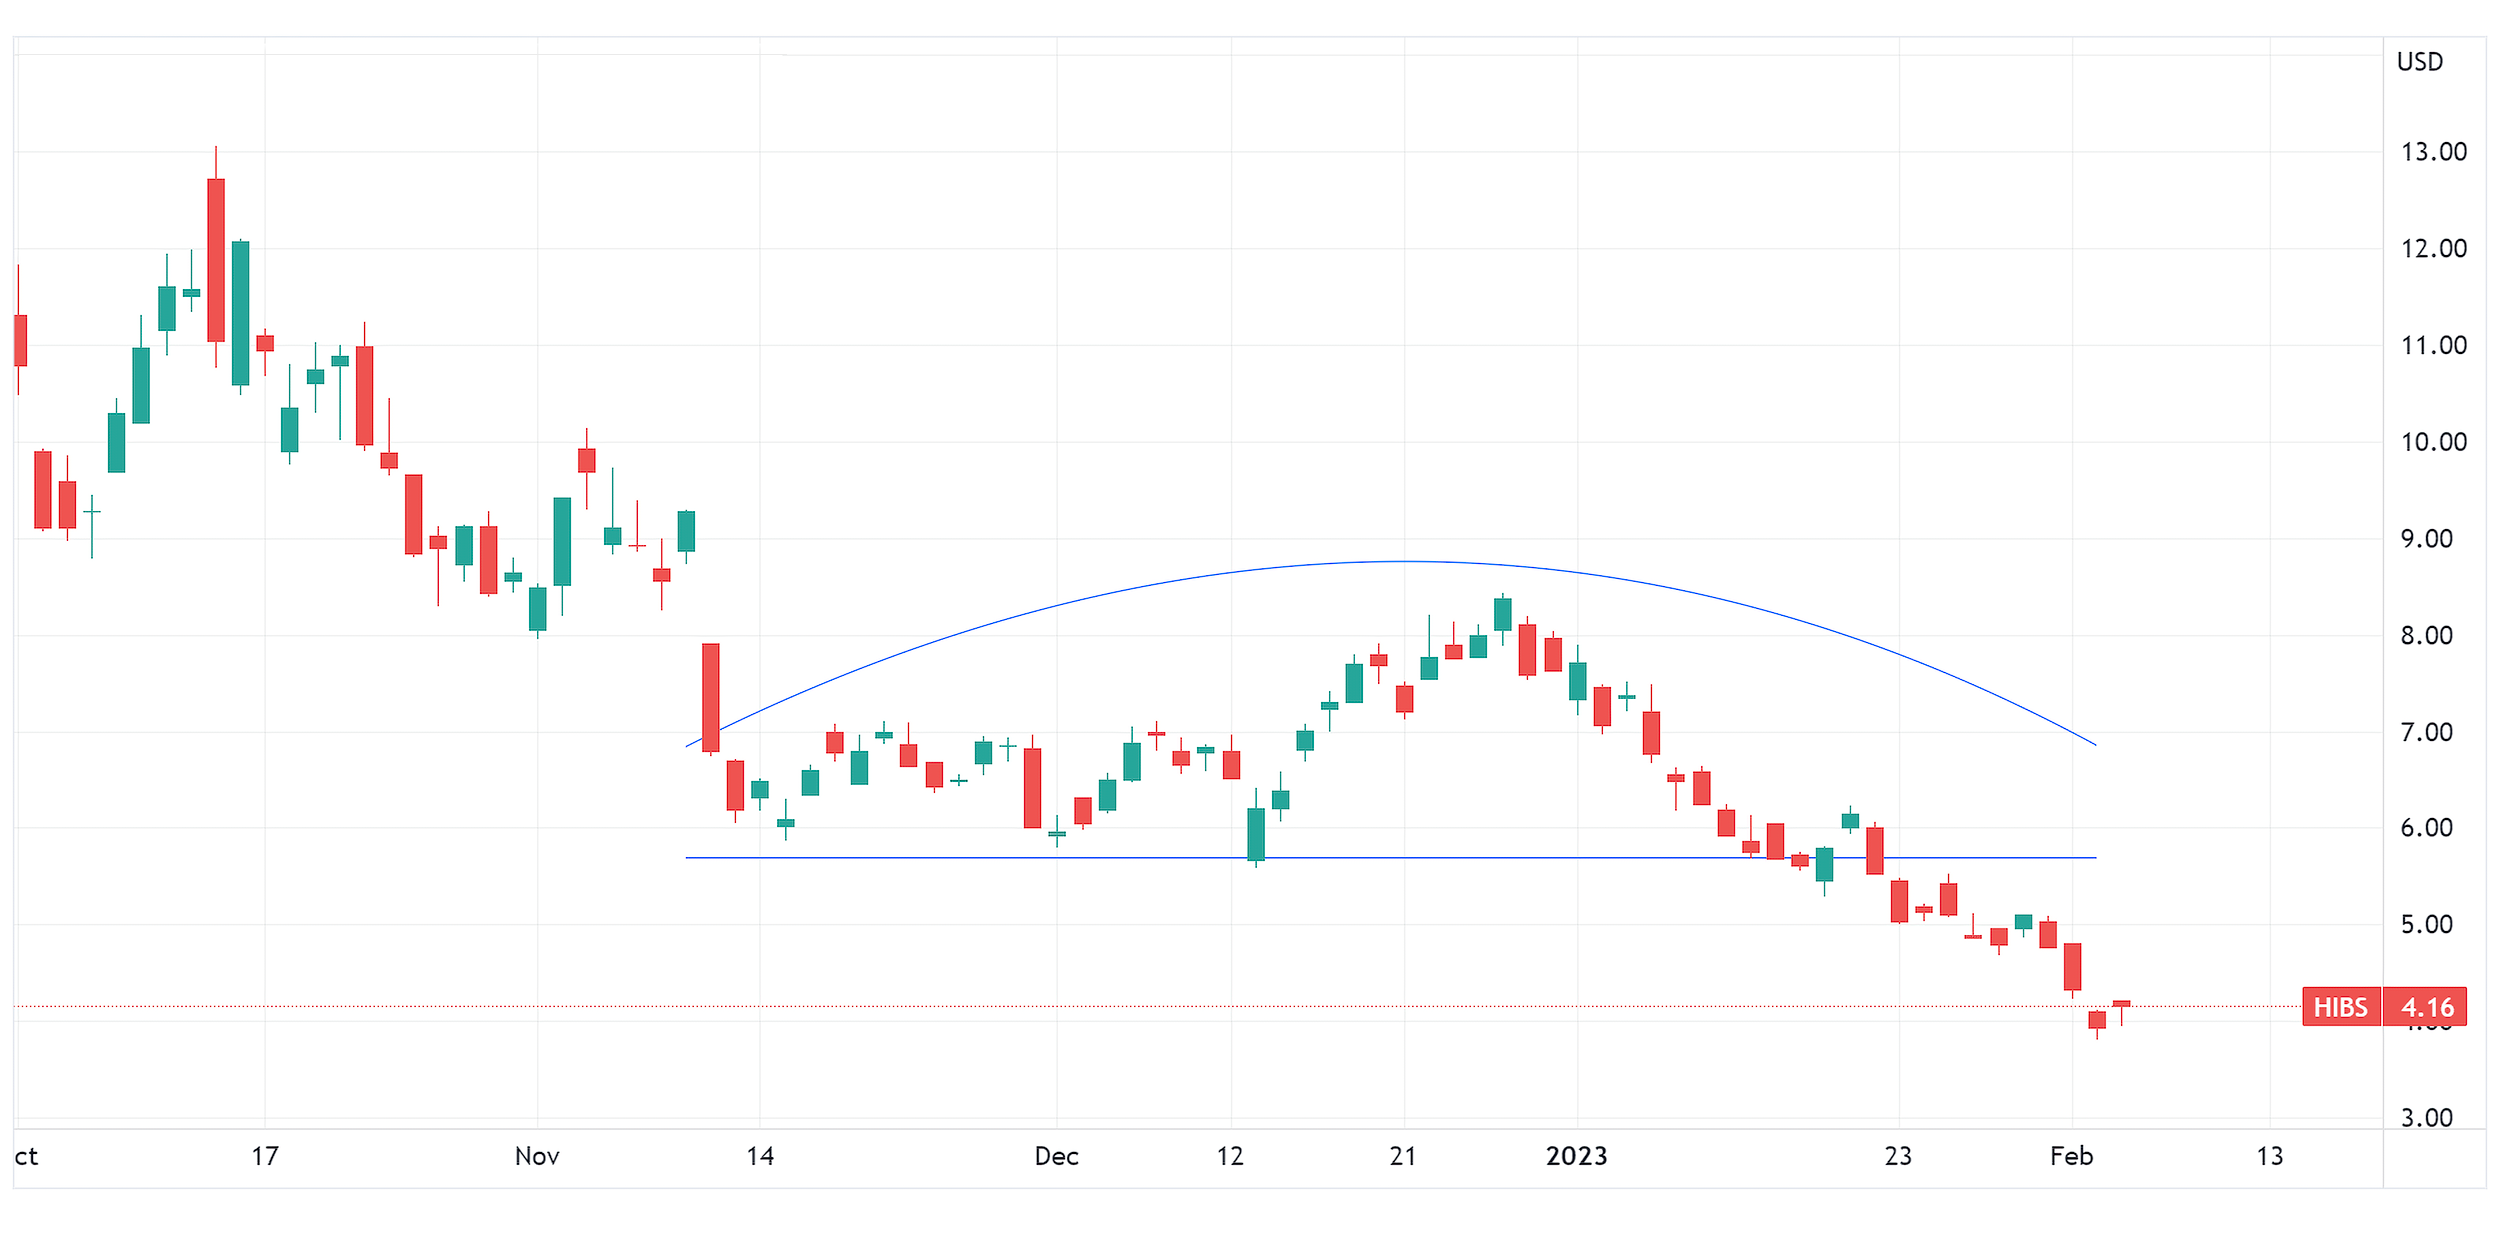
Source: TradingView.com
Candlestick charts display the high and low (the stick) and the open and close price (the body) of a security for a specific period. If the body is filled, it means the close was lower than the open. If the body is empty, it means the close was higher than the open.
The performance data quoted represents past performance. Past performance does not guarantee future results. The investment return and principal value of an investment will fluctuate. An investor’s shares, when redeemed, may be worth more or less than their original cost; current performance may be lower or higher than the performance quoted. For the most recent month-end performance go to Direxion.com/etfs. For standardized performance click here.
Less Risk, Less Reward
Traders that are looking to bet on the short-term direction of equities with a bit less leverage may also consider Direxion’s Daily S&P 500® Bull 2X Shares (Ticker: SPUU). This fund looks to track 200%, before fees and expense, of the daily performance of the S&P 500® Index*. Traders looking to broaden their exposure even further may consider the Direxion Daily S&P 500® Equal Weight Bull 2X Shares (Ticker: EVEN), which aims to track 200%, before fees and expenses, of the daily performance of the S&P 500® Equal Weight Index*.
Definitions:
- Beta is a measure of the volatility—or systematic risk—of a security or portfolio compared to the market as a whole (usually the S&P 500). Stocks with betas higher than 1.0 can be interpreted as more volatile than the S&P 500.
- Earnings per share (EPS) is a company's net profit divided by the number of common shares it has outstanding. EPS indicates how much money a company makes for each share of its stock and is a widely used metric for estimating corporate value.
- The “S&P 500 Index" is a product of S&P Dow Jones Indices LLC ("SPDJI"), and has been licensed for use by Rafferty Asset Management, LLC ("Rafferty"). Standard & Poor’s® and S&P® are registered trademarks of Standard & Poor’s Financial Services LLC ("S&P"); Dow Jones® is a registered trademark of Dow Jones Trademark Holdings LLC ("Dow Jones"); and these trademarks have been licensed for use by SPDJI and sublicensed for certain purposes by Rafferty. Rafferty’s ETFs are not sponsored, endorsed, sold or promoted by SPDJI, Dow Jones, S&P, their respective affiliates and none of such parties make any representation regarding the advisability of investing in such product(s) nor do they have any liability for any errors, omissions, or interruptions of the S&P 500® Index.
- The “S&P 500® Equal Weight Index” is a product of S&P Dow Jones Indices LLC (“SPDJI”), and has been licensed for use by Rafferty. Standard & Poor’s® and S&P® are registered trademarks of Standard & Poor’s Financial Services LLC (“S&P”); Dow Jones® is a registered trademark of Dow Jones Trademark Holdings LLC (“Dow Jones”); and these trademarks have been licensed for use by SPDJI and sublicensed for certain purposes by Rafferty. Rafferty’s ETFs are not sponsored, endorsed, sold or promoted by SPDJI, Dow Jones, S&P, or their respective affiliates and none of such parties make any representation regarding the advisability of investing in such product(s) nor do they have any liability for any errors, omissions, or interruptions of the S&P 500® Equal Weight Index.
An investor should carefully consider a Fund’s investment objective, risks, charges, and expenses before investing. A Fund’s prospectus and summary prospectus contain this and other information about the Direxion Shares. To obtain a Fund’s prospectus and summary prospectus call 866-476-7523 or visit our website at www.direxion.com. A Fund’s prospectus and summary prospectus should be read carefully before investing.
Leveraged and Inverse ETFs pursue daily leveraged investment objectives which means they are riskier than alternatives which do not use leverage. They seek daily goals and should not be expected to track the underlying index over periods longer than one day. They are not suitable for all investors and should be utilized only by sophisticated investors who understand leverage risk and who actively manage their investments.
Direxion Shares Risks – An investment in each Fund involves risk, including the possible loss of principal. Each Fund is non-diversified and include risks associated with the Funds’ concentrating their investments in a particular industry, sector, or geography which can increase volatility. The use of derivatives such as futures contracts and swaps are subject to market risks that may cause their price to fluctuate over time. Risks of each Fund include Effects of Compounding and Market Volatility Risk, Leverage Risk, Market Risk, Counterparty Risk, Rebalancing Risk, Intra-Day Investment Risk, Other Investment Companies (including ETFs) Risk, and risks specific to high beta investing. Beta investing entails investing in securities that are more sensitive to changes in the market, and thus are more volatile based on historical market index data. Additional risks include, for the Direxion Daily S&P 500® High Beta Bull 3X Shares, Daily Index Correlation Risk, and for the Direxion Daily S&P 500® High Beta Bear 3X Shares, risks related to Shorting and Cash Transactions, and Daily Inverse Index Correlation Risk. Please see the summary and full prospectuses for a more complete description of these and other risks of each Fund.