Semiconductors: Riding the AI Wave or Ready to Wipe Out?

Editor's note: Any and all references to time frames longer than one trading day are for purposes of market context only, and not recommendations of any holding time frame. Daily rebalancing ETFs are not meant to be held unmonitored for long periods. If you don't have the resources, time or inclination to constantly monitor and manage your positions, leveraged and inverse ETFs are not for you.
Semiconductor stocks remain the undisputed leaders of this market, but even investors who are optimistic on the sector’s long-term prospects might admit it looks pretty extended at the moment. That’s the thing about semiconductors: They tend to spark highly spirited debates between bulls and bears.
Bulls would argue that we’re still in the early stages of an artificial intelligence (AI) boom and that semiconductor stocks have plenty of juice left in the tank. Bears, on the other hand, might make the case that chip stocks are priced for perfection.
For perspective, the clear leader in semiconductors, Nvidia (Ticker: NVDA), was up over 155% year to date as of July 8 despite a recent pullback. The company’s recent 10-for-1 stock split is a reminder of what a monster it has been since bottoming in late 2023.
From a technical perspective, as a group, semiconductor stocks are notably extended from their moving averages, suggesting the potential for volatility in the short term. However, markets can always get more extended, making it essential for traders to weigh both the bullish and bearish catalysts carefully.
Below is a daily chart of NYSE Semiconductor Index* as of June 24, 2024.
Value of the NYSE Semiconductor Index from January 1, 2024 to July 17, 2024 (USD)
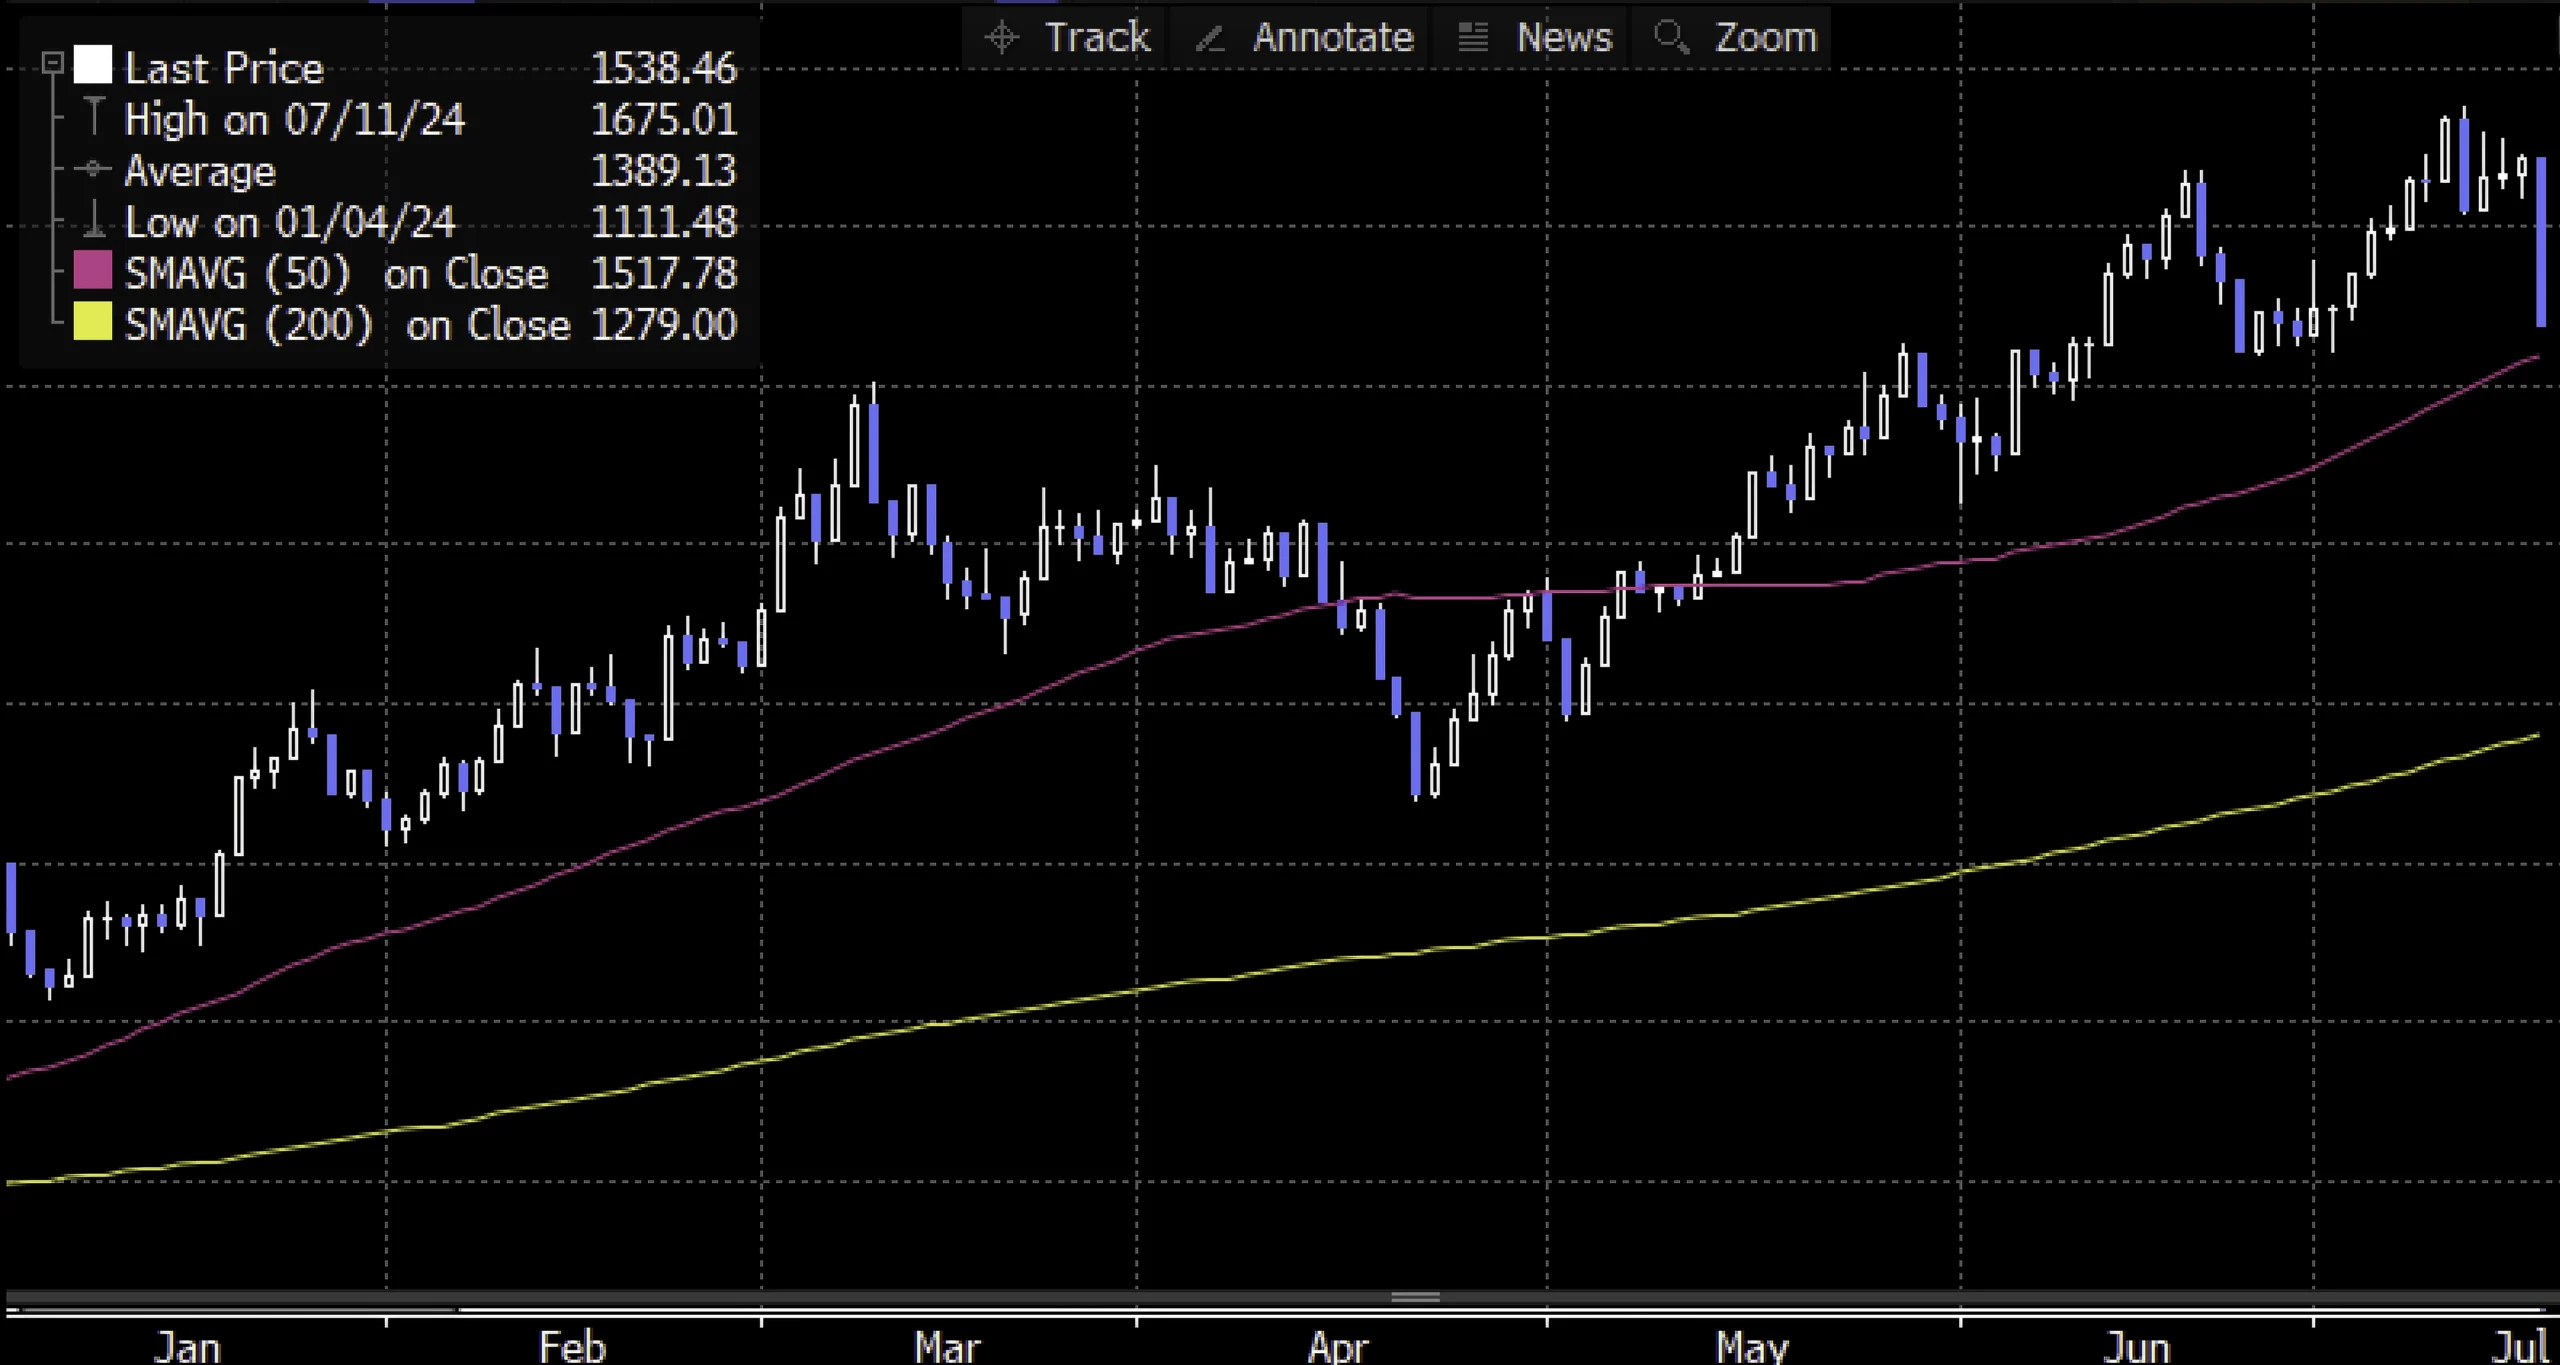
Source: StockCharts.com, June 24, 2024.
Candlestick charts display the high and low (the stick) and the open and close price (the body) of a security for a specific period. If the body is filled, it means the close was lower than the open. If the body is empty, it means the close was higher than the open.
The performance data quoted represents past performance. Past performance does not guarantee future results.
The Pink line represents the 50-day moving average*, while the Yellow line represents the 200-day moving average*.
The Bullish Catalysts for Semiconductors
Although Nvidia is the bellwether for red-hot semiconductors, don’t sleep on other names in the group. Other stocks that have joined the AI party recently include Taiwan Semiconductor (Ticker: TSM), Broadcom (Ticker: AVGO), Qualcomm (Ticker: QCOM), and Micron Technology (Ticker: MU), as Investopedia reports.
Here are some of the bullish triggers that traders may want to keep an eye on for chip stocks:
- Demand for AI and Machine Learning: The explosion in generative AI and machine learning applications is a primary driver for the highflying group. Companies like Nvidia and Advanced Micro Devices (Ticker: AMD) are at the head of the pack, providing the hardware for AI computing. The growth in AI is expected to lead to increased demand for high-performance chips and revenues for semiconductor manufacturers. Data centers, in particular, are undergoing rapid expansion.
- 5G Expansion: The rollout of 5G technology is another potential bullish catalyst. 5G networks require advanced semiconductors to manage higher data rates and increased connectivity. As countries continue to expand their 5G infrastructure, the demand for semiconductors may rise in tandem.
- Autonomous Driving: The road towards autonomous driving technologies is creating substantial opportunities for semiconductor companies. Advanced driver-assistance systems (ADAS) and fully autonomous vehicles rely heavily on high-performance chips for processing data from sensors and making real-time decisions.
- US Government Incentives: The US government has recognized the strategic importance of the semiconductor industry and has introduced incentives to boost domestic production. Initiatives such as the CHIPS and Science Act of 2022 aim to reduce reliance on foreign manufacturers and support the development of critical semiconductor technologies. The subsidies could provide a favorable backdrop for US-based semiconductor companies.
What the Bears Have to Say About Chip Stocks
Semiconductor stocks have pulled back a bit recently, and bears hope this could be the start of something bigger. It does feel like the AI hype has gotten a bit extreme, and overwhelming positive sentiment on a particular sector often leads to sharper corrections amid a quick rush to the exits.
Here are some headwinds that could present problems:
- Reversion to the Mean: The sector index chart above clearly shows how extended chips stocks are to the 50-day and 200-day moving averages*. Historically, sectors that become overextended often experience corrections as traders take profits on the way up and valuations reset.
- Chip Demand Fluctuations: While demand for certain types of chips remains strong, there are signs of softening in other areas. For example, the smartphone and PC markets are showing signs of saturation. Additionally, the cyclical nature of the semiconductor industry means that periods of high demand are often followed by downturns.
- US-China Tensions: Geopolitical tensions between the US and China, particularly over Taiwan, pose a significant risk to the semiconductor sector. Taiwan is home to some of the world's largest semiconductor manufacturers, and any disruption in the region could have a substantial impact on global supply chains and the availability of semiconductors.
- Rising Competition: The semiconductor market is becoming increasingly competitive, with new entrants and existing players investing heavily in research and development. This competition could lead to pricing pressures and reduced profit margins for established companies.
Trading Semiconductors With Leverage
Semiconductors may be at a crossroads with compelling arguments on both sides for bulls and bears.
Aggressive traders looking to potentially amplify short-term gains in either direction may consider Direxion’s Daily Semiconductor Bull 3X Shares (Ticker: SOXL) and Daily Semiconductor Bear 3X Shares (Ticker: SOXS). They seek daily investment results, before fees and expenses, of 300%, or 300% of the inverse (or opposite), of the performance of the NYSE Semiconductor Index.
*Definitions and Index Descriptions
An investor should carefully consider a Fund’s investment objective, risks, charges, and expenses before investing. A Fund’s prospectus and summary prospectus contain this and other information about the Direxion Shares. To obtain a Fund’s prospectus and summary prospectus call 866-476-7523 or visit our website at direxion.com. A Fund’s prospectus and summary prospectus should be read carefully before investing.
Leveraged and Inverse ETFs pursue daily leveraged investment objectives which means they are riskier than alternatives which do not use leverage. They seek daily goals and should not be expected to track the underlying index over periods longer than one day. They are not suitable for all investors and should be utilized only by sophisticated investors who understand leverage risk and who actively manage their investments.
NYSE Semiconductor Index (ICESEMIT) is a rules-based, modified float-adjusted market capitalization-weighted index that tracks the performance of the thirty largest U.S. listed semiconductor companies.
One cannot invest directly in an index.
Neither Rafferty nor the Direxion Daily Semiconductor Bull 3X Shares and the Direxion Daily Semiconductor Bear 3X Shares (the “Financial Products”) are sponsored, endorsed, sold or promoted by Interactive Data Pricing and Reference Data, LLC or its affiliates (“Vendor”). Vendor makes no representation or warranty regarding the advisability of investing in securities generally, in the Financial Products particularly, or the ability of the NYSE Semiconductor Index to track general financial market performance. VENDOR MAKES NO EXPRESS OR IMPLIED WARRANTIES, AND HEREBY EXPRESSLY DISCLAIMS ALL WARRANTIES OF MERCHANTABILITY OR FITNESS FOR A PARTICULAR PURPOSE WITH RESPECT TO THE INDEX OR ANY DATA INCLUDED THEREIN.IN NO EVENT SHALL VENDOR HAVE ANY LIABILITY FOR ANY SPECIAL, PUNITIVE, INDIRECT, OR CONSEQUENTIAL DAMAGES (INCLUDING LOST PROFITS),EVEN IF NOTIFIED OF THE POSSIBILITY OF SUCH DAMAGES.
Direxion Shares Risks – An investment in each Fund involves risk, including the possible loss of principal. Each Fund is non-diversified and includes risks associated with the Funds’ concentrating their investments in a particular industry, sector, or geographic region which can result in increased volatility. The use of derivatives such as futures contracts and swaps are subject to market risks that may cause their price to fluctuate over time. Risks of each Fund include Effects of Compounding and Market Volatility Risk, Leverage Risk, Market Risk, Counterparty Risk, Rebalancing Risk, Intra-Day Investment Risk, Other Investment Companies (including ETFs) Risk, Cash Transaction Risk, Passive Investment and Index Performance Risk, and risks specific to the semiconductor industry. Companies that are in the semiconductor industry may be affected by particular economic or market events, which may, in certain circumstances, cause the value of securities of all companies in the semiconductor sector of the market to decrease. Additional risks include, for the Direxion Daily Semiconductor Bull 3X Shares, Daily Index Correlation Risk, and for the Direxion Daily Semiconductor Bear 3X Shares, Shorting or Inverse Risk and Daily Inverse Index Correlation Risk. Please see the summary and full prospectuses for a more complete description of these and other risks of each Fund.