
Editor's note: Any and all references to time frames longer than one trading day are for purposes of market context only, and not recommendations of any holding time frame. Daily rebalancing ETFs are not meant to be held unmonitored for long periods. If you don't have the resources, time or inclination to constantly monitor and manage your positions, leveraged and inverse ETFs are not for you.
After an initial selloff to start the year, the precious metal mining sector found its footing in February and staged an impressive rally to multi-month highs. But since peaking back in May, the sector has been on the retreat lower ever since. Is the sector setting the stage for another rebound higher from its next low? Or is the macroeconomic outlook becoming hostile for metals again?
Metals and Monetary Policy
Around the world, we’ve started to see central banks move towards a more accommodative monetary policy. Just last week, the Swiss National Bank cut rates again, and for the second time this year.
Among other major central banks embarking on dovish monetary policy, there’s the European Central Bank and the Bank of Canada. Monetary easing is a double-edged sword. It means that inflation* is starting to slow down, but it also brings the possibility of a recession, or slower economic growth.
The question on the mind of traders is if and when the Federal Reserve will cut interest rates. For clues, the next Consumer Price Index (CPI)* report is on July 11, and if it comes in below estimates, it could entice the Fed to cut rates this year. This could be a bullish catalyst for precious metals, and shares of mining companies.
In this situation, Direxion’s Daily Gold Miners Index Bull 2X Shares (Ticker: NUGT), which seeks daily investment results, before fees and expenses, of 200% of the performance of the NYSE Arca Gold Miners Index* could see a nice bid.
Below is a daily chart of NUGT as of June 20, 2024.
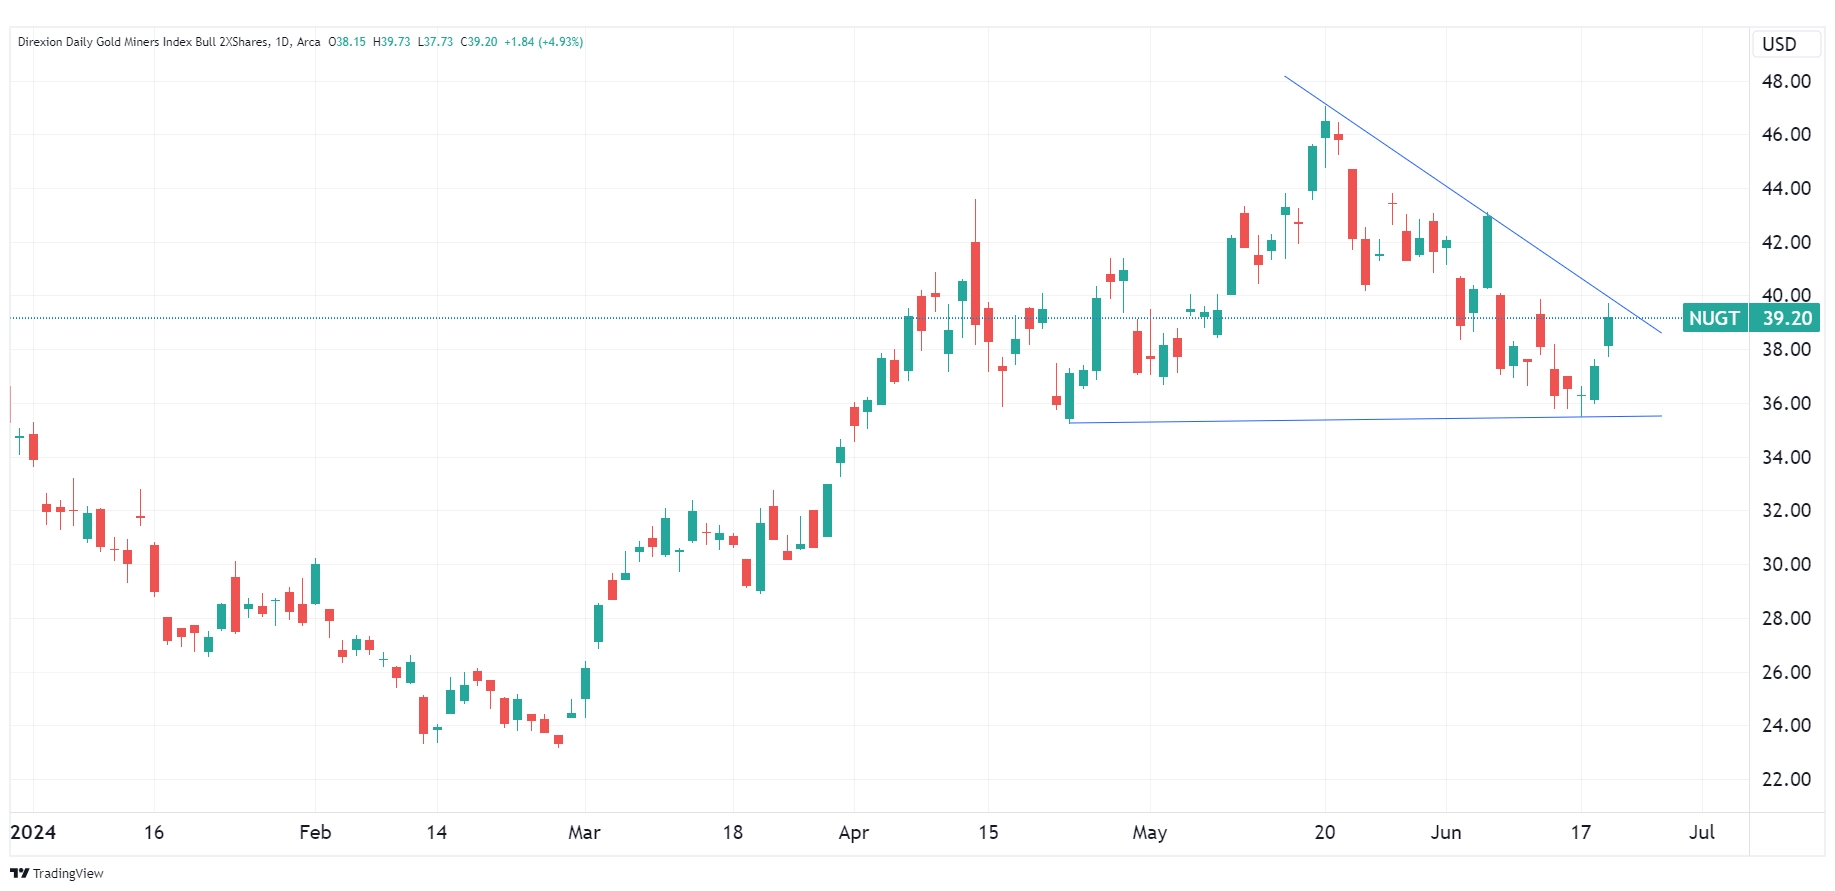
Source: TradingView.com
Candlestick charts display the high and low (the stick) and the open and close price (the body) of a security for a specific period. If the body is filled, it means the close was lower than the open. If the body is empty, it means the close was higher than the open.
The performance data quoted represents past performance. Past performance does not guarantee future results. The investment return and principal value of an investment will fluctuate. An investor’s shares, when redeemed, may be worth more or less than their original cost; current performance may be lower or higher than the performance quoted. For the most recent month-end performance go to Direxion.com/etfs. For standardized performance click here.
The slanted blue lines represent an uptrend and/or downtrend. An uptrend describes the price movement of a financial asset when the overall direction is upward. A downtrend describes the price movement of a financial asset when the overall direction is downward.
Could Economic Outperformance Keep Metals Contained?
Typically, precious metals and shares of mining companies perform better during periods of economic or geopolitical turbulence. There have been persistent calls for a period of economic underperformance, but the resiliency of the labor market continues to keep consumption and investments elevated.
The next report on the employment situation could be critical for metal miners. If the labor market remains strong and keeps outperforming, it could put a lid on the miner performance. The next report is set to be released on July 5.
If the economy continues outperforming, Direxion’s Daily Gold Miners Index Bear 2X Shares (Ticker: DUST), which seeks daily investment results, before fees and expenses, of 200% of the inverse (or opposite) of the performance of the NYSE Arca Gold Miners Index could provide a unique opportunity.
Below is a daily chart of DUST as of June 20, 2024.
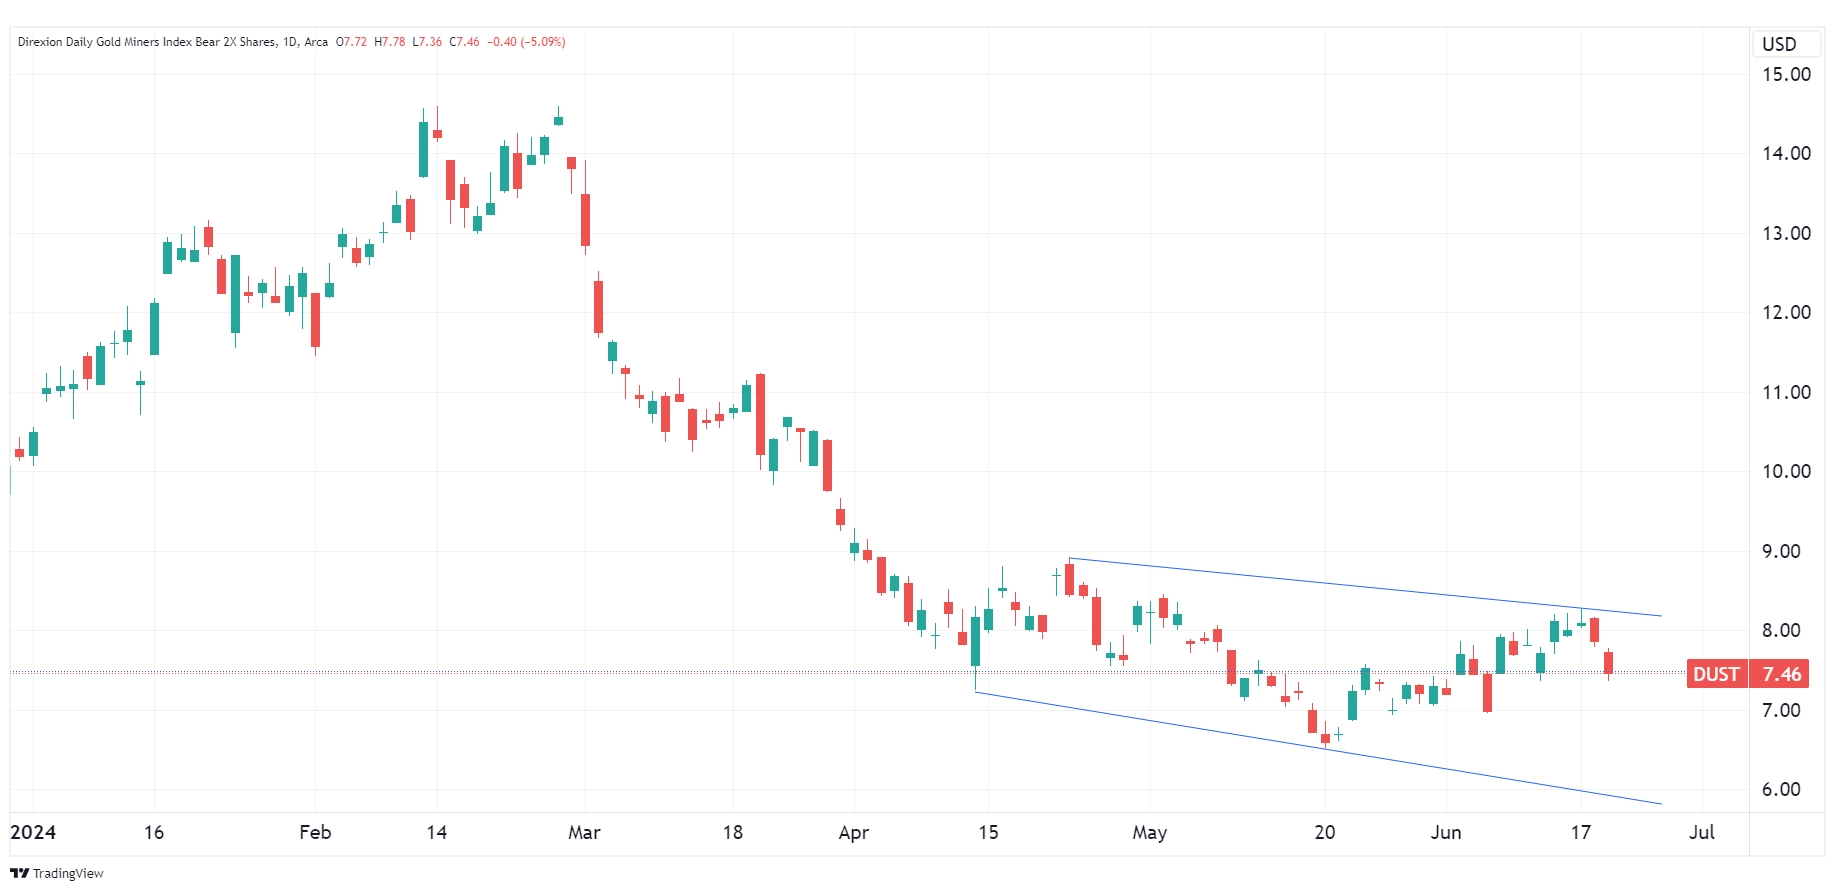
Source: TradingView.com
Candlestick charts display the high and low (the stick) and the open and close price (the body) of a security for a specific period. If the body is filled, it means the close was lower than the open. If the body is empty, it means the close was higher than the open.
The performance data quoted represents past performance. Past performance does not guarantee future results. The investment return and principal value of an investment will fluctuate. An investor’s shares, when redeemed, may be worth more or less than their original cost; current performance may be lower or higher than the performance quoted. For the most recent month-end performance go to Direxion.com/etfs. For standardized performance click here.
The slanted blue line represents a downtrend. A downtrend describes the price movement of a financial asset when the overall direction is downward.
More Metal and Commodity Plays
Traders looking for more volatile action in the precious metal mining space may consider Direxion’s Daily Junior Gold Miners Index Bull 2X Shares (Ticker: JNUG) or the Daily Junior Gold Miners Index Bear 2X Shares (Ticker: JDST), which seeks daily investment results, before fees and expenses, of 200%, or -200%, respectively, of the performance of the MVIS Global Junior Gold Miners Index*.
Those looking for commodity-related plays may also consider energy sector funds such as Direxion’s Daily S&P Oil & Gas Exp. & Prod. Bull 2X Shares (Ticker: GUSH) or the Daily S&P Oil & Gas Exp. & Prod. Bear 2X Shares (Ticker: DRIP), which seeks daily investment results, before fees and expenses, of 200%, or -200%, respectively, of the performance of the S&P Oil & Gas Exploration & Production Select Industry Index*.
*Definitions and Index Descriptions
An investor should carefully consider the Fund’s investment objective, risks, charges, and expenses before investing. The Fund’s prospectus and summary prospectus contain this and other information about the Direxion Shares. To obtain the Fund’s prospectus and summary prospectus call 866-476-7523 or visit our website at direxion.com. The Fund’s prospectus and summary prospectus should be read carefully before investing.
Leveraged and Inverse ETFs pursue daily leveraged investment objectives which means they are riskier than alternatives which do not use leverage. They seek daily goals and should not be expected to track the underlying index over periods longer than one day. They are not suitable for all investors and should be utilized only by sophisticated investors who understand leverage risk and who actively manage their investments.
The NYSE Arca Gold Miners Index (GDMNTR) is a modified market capitalization weighted index comprised of publicly traded companies that operate globally in both developed and emerging markets, and are involved primarily in mining for gold and, to a lesser extent, in mining for silver. The Index will limit the weight of companies whose revenues are more significantly exposed to silver mining to less than 20% of the Index at each rebalance date. The Index may include small- and mid-capitalization companies and foreign issuers.
The MVIS Global Junior Gold Miners Index (MVGDXJTR) tracks the performance of foreign and domestic micro-, small- and mid-capitalization companies that generate, or demonstrate the potential to generate, at least 50% of their revenues from, or have at least 50% of their assets related to, gold mining and/or silver mining, hold real property or have mining projects that have the potential to produce at least 50% of the company’s revenue from gold or silver mining when developed, or primarily invest in gold or silver.
The S&P Oil & Gas Exploration & Production Select Industry Index (SPSIOPTR) is provided by S&P Dow Jones Indices, LLC and includes domestic companies from the oil and gas exploration and production sub-industry. The Index is a modified equal-weighted index that is designed to measure the performance of a sub-industry or group of sub-industries determined based on the Global Industry Classification Standards (GICS).
One cannot directly invest in an index.
Direxion Shares Risks – An investment in each Fund involves risk, including the possible loss of principal. Each Fund is non-diversified and includes risks associated with the Funds’ concentrating their investments in a particular industry, sector, or geographic region which can result in increased volatility. The use of derivatives such as futures contracts and swaps are subject to market risks that may cause their price to fluctuate over time. Risks of each Fund include Effects of Compounding and Market Volatility Risk, Leverage Risk, Market Risk, Counterparty Risk, Rebalancing Risk, Intra-Day Investment Risk, Other Investment Companies (including ETFs) Risk, Cash Transaction Risk, Passive Investment and Index Performance Risk, and risks specific to investment in securities of gold and silver mining companies and the mining and metal industry. Because the Funds’ Index is concentrated in the gold mining industry and may have significant exposure to assets in the silver mining industry, the Funds will be sensitive to changes in the overall condition of gold- and silver-related companies. Competitive pressures may have a significant effect on the financial condition of gold- and silver-related companies. In addition, for the Direxion Daily Gold Miners Index Bull 2X Shares, Daily Index Correlation Risk, and for the Direxion Daily Gold Miners Index Bear 2X Shares, Shorting or Inverse Risk and Daily Inverse Index Correlation Risk. Please see the summary and full prospectuses for a more complete description of these and other risks of each Fund.