Editor’s note: Any and all references to time frames longer than one trading day are for purposes of market context only, and not recommendations of any holding time frame. Daily rebalancing ETFs are not meant to be held unmonitored for long periods. If you don't have the resources, time or inclination to constantly monitor and manage your positions, leveraged and inverse ETFs are not for you.
Is Energy Showing Signs of a Rebound?
Despite the hotter-than-expected Consumer Price Index (CPI)* print in September, the performance of the energy sector has largely remained in the doldrums for much of 2024. The big question now is whether additional stimulus from the Federal Reserve will reignite inflationary* pressure for real, and if so, whether the energy sector can benefit from it.
Is Supply or Inflation the Bigger Tailwind?
Going into 2025, OPEC remains committed to production cuts, which should lower the global supply of oil. The general idea is that if supply is down, prices go up, but there’s always demand to factor into the equation as well.
But with the Federal Reserve adding back to the money supply via rate cuts now, there is a real risk of inflation starting to tick higher again. We may have seen some of the preliminary signs of renewed price increases with the September inflation report.
Traders would be wise to keep an eye on the next CPI inflation report, which is set to be released on November 13. If it comes in above estimates, and the Fed continues to ease, it could be a signal that inflationary pressures haven't let up. The next FOMC meeting on November 7 will also be important.
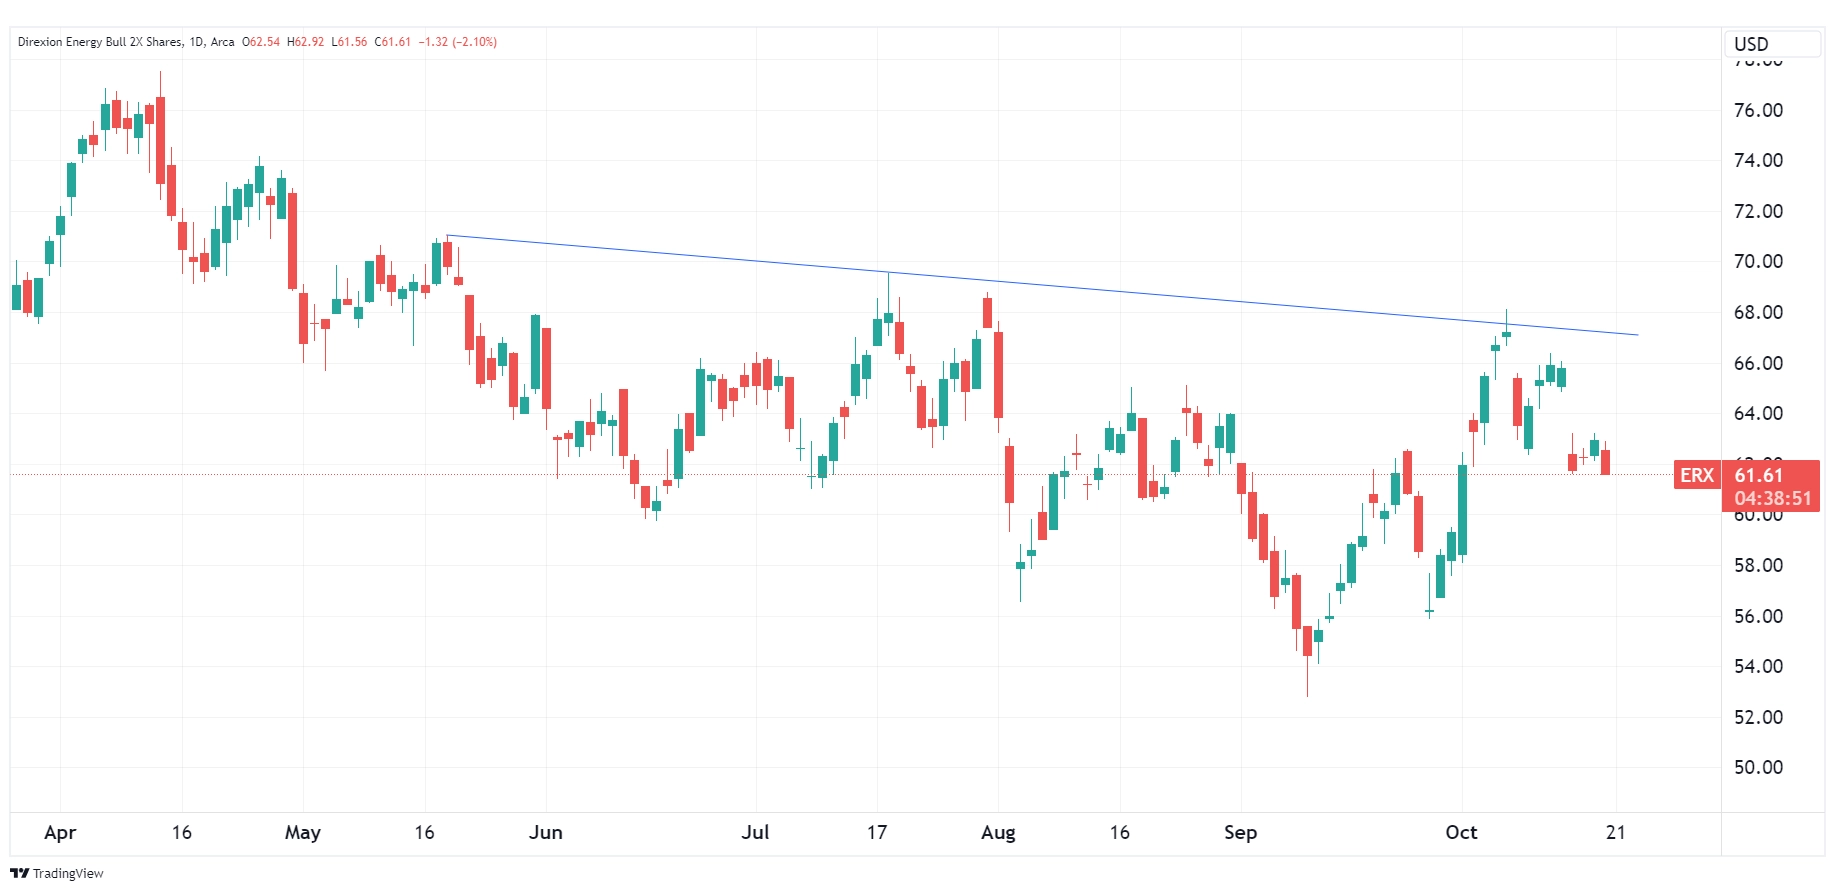
In this situation, Direxion’s Daily Energy Bull 2X Shares (Ticker: ERX) could see a bid. This ETF seeks daily investment results, before fees and expenses, of 200% of the performance of the Energy Select Sector Index*.
Below is a daily chart of ERX as of October 10, 2024.

Source: TradingView.com
Candlestick charts display the high and low (the stick) and the open and close price (the body) of a security for a specific period. If the body is filled, it means the close was lower than the open. If the body is empty, it means the close was higher than the open.
The performance data quoted represents past performance. Past performance does not guarantee future results. The investment return and principal value of an investment will fluctuate. An investor’s shares, when redeemed, may be worth more or less than their original cost; current performance may be lower or higher than the performance quoted. For the most recent month-end performance go to Direxion.com/etfs. For standardized performance click here.
Economic Slowdown Risks and Demand
One of the biggest considerations that could keep energy prices down is a potential economic slowdown. While recent GDP data has come in above estimates, we can't forget that the Fed is easing now because of past and present economic storm clouds.
When the economy slows, energy demand typically drops. On the supply end of the equation, there is also much more production taking place in the United States compared to years past, so even with OPEC’s supply cuts, the reduction could be made up for domestically.
If energy prices remain subdued, it could make it difficult for energy producers and refiners to grow their earnings. In this scenario, Direxion’s Daily Energy Bear 2X Shares (Ticker: ERY), which seeks daily investment results, before fees and expenses, of 200% of the inverse (or opposite) of the performance of the Energy Select Sector Index, could provide a nice opportunity – as long as you choose the right direction.
Below is a daily chart of ERY as of October 10, 2024.

Source: TradingView.com
Candlestick charts display the high and low (the stick) and the open and close price (the body) of a security for a specific period. If the body is filled, it means the close was lower than the open. If the body is empty, it means the close was higher than the open.
The performance data quoted represents past performance. Past performance does not guarantee future results. The investment return and principal value of an investment will fluctuate. An investor’s shares, when redeemed, may be worth more or less than their original cost; current performance may be lower or higher than the performance quoted. For the most recent month-end performance go to Direxion.com/etfs. For standardized performance click here.
Other Energy and Commodity Trades
There is an additional pair of energy-related funds offered by Direxion, which are the Direxion Daily S&P Oil & Gas Exp. & Prod. Bull 2X Shares (Ticker: GUSH) and Direxion Daily S&P Oil & Gas Exp. & Prod. Bear 2X Shares (Ticker: DRIP). These seek daily investment results, before fees and expenses, of 200%, or -200%, respectively, of the performance of the S&P Oil & Gas Exploration & Production Select Industry Index*.
There are also funds to trade the precious metal mining sector. The Direxion Daily Gold Miners Index Bull 2X Shares (Ticker: NUGT) and Direxion Daily Gold Miners Index Bear 2X Shares (Ticker: DUST) seek daily investment results, before fees and expenses, of 200%, or -200%, respectively, of the performance of the NYSE Arca Gold Miners Index.
*Definitions and Index Descriptions
An investor should carefully consider a Fund’s investment objective, risks, charges, and expenses before investing. A Fund’s prospectus and summary prospectus contain this and other information about the Direxion Shares. To obtain a Fund’s prospectus and summary prospectus call 866-476-7523 or visit our website at direxion.com. A Fund’s prospectus and summary prospectus should be read carefully before investing.
Leveraged and Inverse ETFs pursue daily leveraged investment objectives which means they are riskier than alternatives which do not use leverage. They seek daily goals and should not be expected to track the underlying index over periods longer than one day. They are not suitable for all investors and should be utilized only by sophisticated investors who understand leverage risk and who actively manage their investments.
The “Energy Select Sector Index” is a product of S&P Dow Jones Indices LLC (“SPDJI”), and has been licensed for use by Rafferty Asset Management, LLC (“Rafferty”). Standard & Poor’s® and S&P® are registered trademarks of Standard & Poor’s Financial Services LLC (“S&P”); Dow Jones® is a registered trademark of Dow Jones Trademark Holdings LLC (“Dow Jones”); and these trademarks have been licensed for use by SPDJI and sublicensed for certain purposes by Rafferty. Rafferty’s ETFs are not sponsored, endorsed, sold or promoted by SPDJI, Dow Jones, S&P, their respective affiliates and none of such parties make any representation regarding the advisability of investing in such product(s) nor do they have any liability for any errors, omissions, or interruptions of the Energy Select Sector Index.
The Energy Select Sector Index (IXETR) is provided by S&P Dow Jones Indices and includes domestic companies from the energy sector which includes the following industries: oil, gas and consumable fuels; and energy equipment and services.
The S&P Oil & Gas Exploration & Production Select Industry Index (SPSIOPTR) is provided by S&P Dow Jones Indices, LLC and includes domestic companies from the oil and gas exploration and production sub-industry. The Index is a modified equal-weighted index that is designed to measure the performance of a sub-industry or group of sub-industries determined based on the Global Industry Classification Standards (GICS).
The NYSE Arca Gold Miners Index (GDMNTR) is a modified market capitalization weighted index comprised of publicly traded companies that operate globally in both developed and emerging markets, and are involved primarily in mining for gold and, to a lesser extent, in mining for silver. The Index will limit the weight of companies whose revenues are more significantly exposed to silver mining to less than 20% of the Index at each rebalance date. The Index may include small- and mid-capitalization companies and foreign issuers.
One cannot directly invest in an index.
Direxion Shares Risks – An investment in a Fund involves risk, including the possible loss of principal. A Fund is non-diversified and includes risks associated with the Fund’s concentrating its investments in a particular industry, sector, or geography which can increase volatility. The use of derivatives such as futures contracts and swaps are subject to market risks that may cause prices to fluctuate over time.
Leverage Risk – Each Fund obtains investment exposure in excess of its net assets by utilizing leverage and may lose more money in market conditions that are adverse to its investment objective than a fund that does not utilize leverage. A total loss may occur in a single day. Leverage will also have the effect of magnifying any differences in the Fund’s correlation or inverse correlation with the Index and may increase the volatility of the Fund.
Daily Index Correlation Risk – A number of factors may affect the Bull Fund’s ability to achieve a high degree of correlation with the Index and therefore achieve its daily leveraged investment objective. The Bull Fund’s exposure to the Index is impacted by the Index’s movement. Because of this, it is unlikely that the Bull Fund will be perfectly exposed to the Index at the end of each day. The possibility of the Bull Fund being materially over- or under-exposed to the Index increases on days when the Index is volatile near the close of the trading day.
Daily Inverse Index Correlation Risk – A number of factors may affect the Bear Fund’s ability to achieve a high degree of inverse correlation with the Index and therefore achieve its daily inverse leveraged investment objective. The Bear Fund’s exposure to the Index is impacted by the Index’s movement. Because of this, it is unlikely that the Bear Fund will be perfectly exposed to the Index at the end of each day. The possibility of the Bear Fund being materially over- or under-exposed to the Index increases on days when the Index is volatile near the close of the trading day.
Energy Sector Risk – Energy sector securities may be adversely impacted by changes in the levels and volatility of global energy prices, global supply and demand, and capital expenditures on the exploration and production of energy sources.
Additional risks of each Fund include Effects of Compounding and Market Volatility Risk, Market Risk, Counterparty Risk, Rebalancing Risk, Intra-Day Investment Risk, Other Investment Companies (including ETFs Risk), Cash Transaction Risk, Passive Investment and Index Performance Risk and for the Direxion Daily Energy Bear 2X Shares, Shorting or Inverse Risk. Please see the summary and full prospectuses for a more complete description of these and other risks of a Fund.
