Editor's note: Any and all references to time frames longer than one trading day are for purposes of market context only, and not recommendations of any holding time frame. Daily rebalancing ETFs are not meant to be held unmonitored for long periods. If you don't have the resources, time or inclination to constantly monitor and manage your positions, leveraged and inverse ETFs are not for you.
The Chinese equity market has soared over the past couple of weeks, trapping shorts and reigniting enthusiasm surrounding a new potential bull trend. It seems that the stimulus efforts from the politburo and the People’s Bank of China may finally be paying off in the near-term. But the trillion dollar question is how long this rally can last before a retracement occurs.
Late-September Stimulus Surprise
China is clearly not playing games when it comes to stimulus, as the country recently launched its largest stimulus package since the covid crash of 2020. The package included a half-percent rate cute of the reserve requirement ratio, slashing of mortgage rates for existing home loans and reducing minimum down payment requirements, and finally, a new ability to borrow liquid assets to post margin in the stock market.
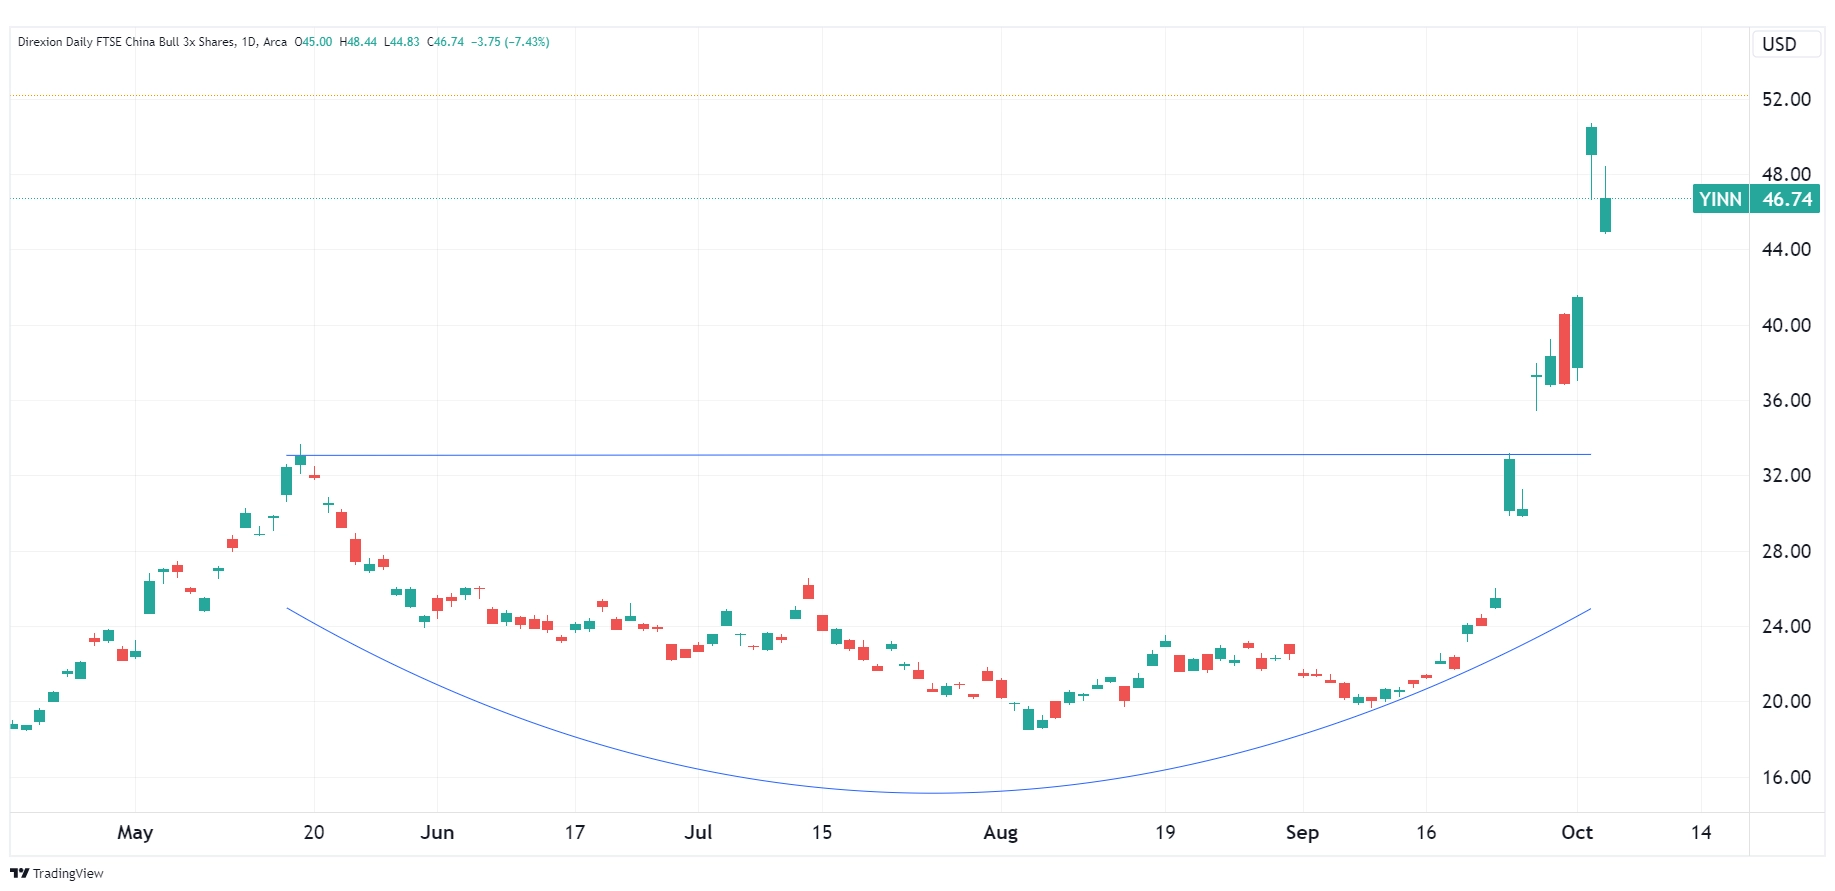
Chinese stocks have already exploded to the upside following these policy announcements, and have brought back to life a stock market that essentially did nothing for a couple of years. If this continues, evidence suggests that the rally is still in its early innings.
Traders looking to capitalize on China’s rebound may find a position with Direxion’s Daily FTSE China Bull 3X Shares (Ticker: YINN). This seeks daily investment results, before fees and expenses, of 300% of the performance in the FTSE China 50 Index*.
Below is a daily chart of YINN as of October 3, 2024.

Source: TradingView.com
Candlestick charts display the high and low (the stick) and the open and close price (the body) of a security for a specific period. If the body is filled, it means the close was lower than the open. If the body is empty, it means the close was higher than the open.
The performance data quoted represents past performance. Past performance does not guarantee future results. The investment return and principal value of an investment will fluctuate. An investor’s shares, when redeemed, may be worth more or less than their original cost; current performance may be lower or higher than the performance quoted. For the most recent month-end performance go to Direxion.com/etfs. For standardized performance click here.
Stimulus Doesn’t Always Mean Results
Despite the enthusiasm regarding China’s recent stimulus, it’s imperative to remember that such measures don’t automatically translate into positive results. If anything, they produce the right conditions or incentives for such results, but the intricate workings of the economy can be much more nuanced.
Not to mention, China is still struggling with weak loan demand, as well as geopolitical concerns. The big question will be whether these stimulus measures can translate to earnings growth for some of the country’s largest companies, which include names like Tencent Holdings, Alibaba, and Meituan.
Tencent is estimated to release their next earnings report on November 12, Alibaba is slated for November 21, and Meituan is estimated to have its next earnings release on November 26. If these reports missed on top or bottom lines, it could lead to a meaningful reversal in the rally we’ve seen in Chinese equities so far. Earnings dates are subject to risk and change.
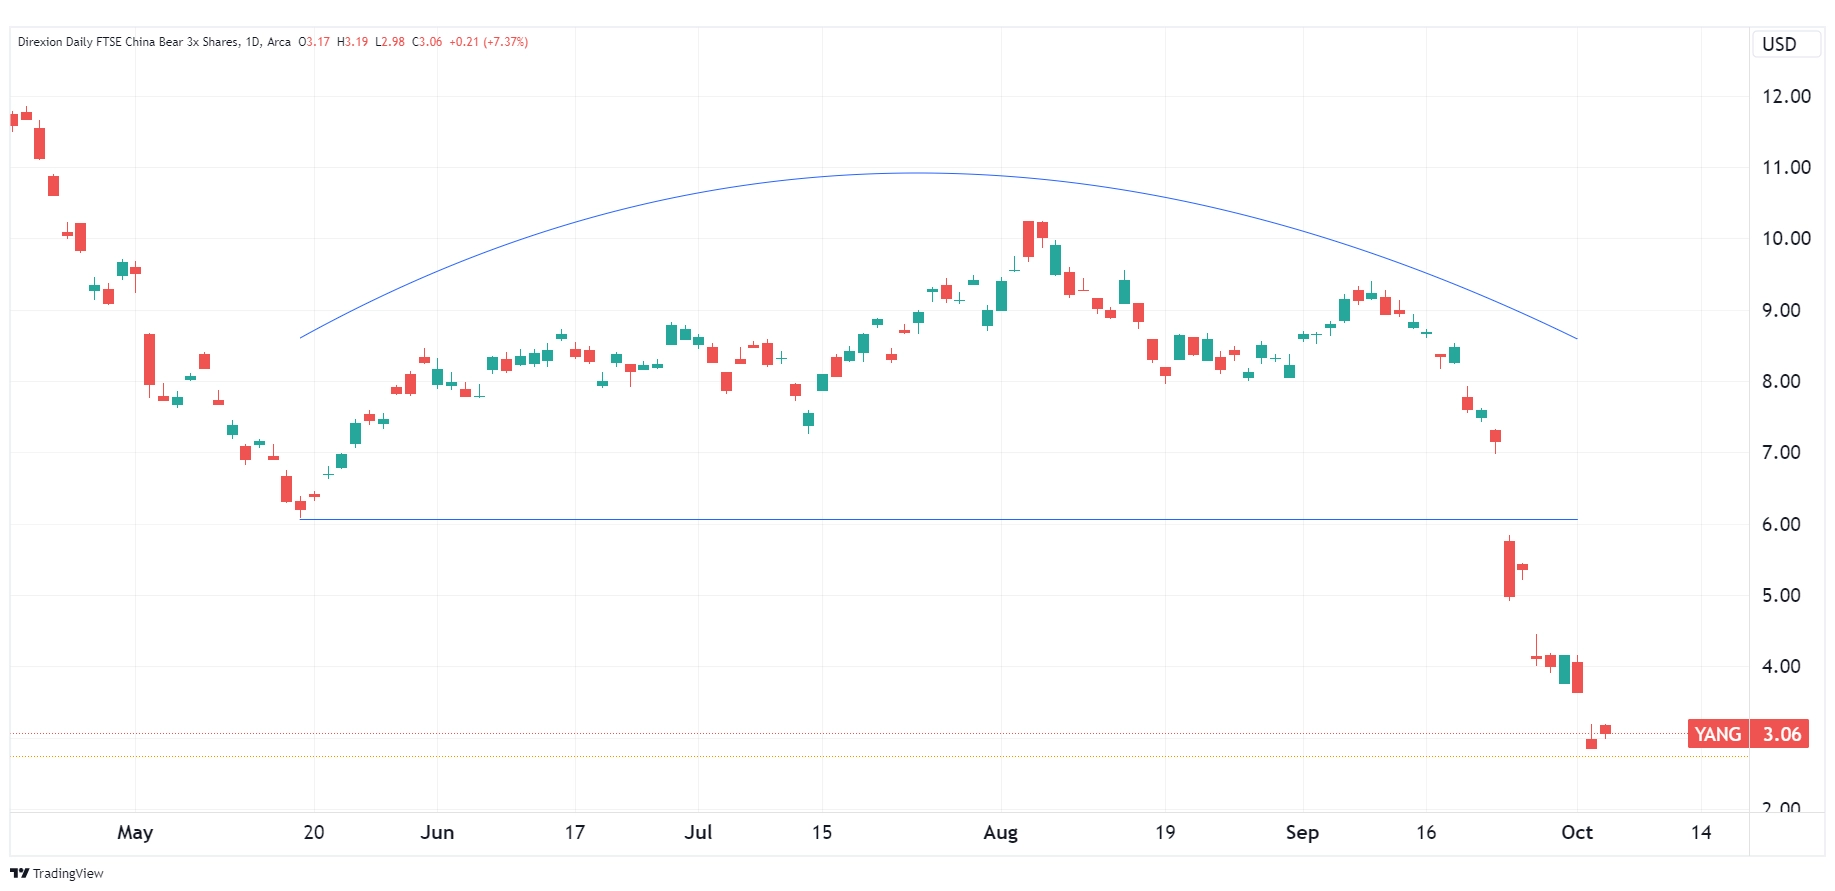
In this situation, Direxion’s Daily FTSE China Bear 3X Shares (Ticker: YANG) could see a bid. This fund seeks daily investment results, before fees and expenses, of 300% of the inverse performance in the FTSE China 50 Index.
Below is a daily chart of YANG as of October 3, 2024.

Source: TradingView.com
Candlestick charts display the high and low (the stick) and the open and close price (the body) of a security for a specific period. If the body is filled, it means the close was lower than the open. If the body is empty, it means the close was higher than the open.
The performance data quoted represents past performance. Past performance does not guarantee future results. The investment return and principal value of an investment will fluctuate. An investor’s shares, when redeemed, may be worth more or less than their original cost; current performance may be lower or higher than the performance quoted. For the most recent month-end performance go to Direxion.com/etfs. For standardized performance click here.
More China and Emerging Market Opportunities
Direxion offers traders additional ways to speculate in the Chinese equity market, but also in the broader emerging market sector overall.
Traders looking to trade emerging markets may find positions in the Direxion Daily MSCI Emerging Markets Bull 3X Shares (Ticker: EDC) and Direxion Daily MSCI Emerging Markets Bear 3X Shares (Ticker: EDZ). These seek daily investment results, before fees and expenses, of 300%, or -300%, respectively, of the performance of the MSCI Emerging Markets Index*.
For those seeking less leverage to trade Chinese markets, there’s also the Direxion Daily CSI 300 China A Share Bull 2X Shares (Ticker: CHAU), which seeks daily investment results, before fees and expenses, of 200% of the performance of the CSI 300 Index.
Finally, there is the Direxion Daily CSI China Internet Index Bull 2X Shares (Ticker: CWEB), which may be appropriate for traders looking to trade Chinese internet stocks. This fund seeks daily investment results, before fees and expenses, of 200% of the performance of the CSI Overseas China Internet Index*.
*Definitions and Index Descriptions
An investor should carefully consider a Fund’s investment objective, risks, charges, and expenses before investing. A Fund’s prospectus and summary prospectus contain this and other information about the Direxion Shares. To obtain a Fund’s prospectus and summary prospectus call 866-476-7523 or visit our website at direxion.com. A Fund’s prospectus and summary prospectus should be read carefully before investing.
Leveraged and Inverse ETFs pursue daily leveraged investment objectives which means they are riskier than alternatives which do not use leverage. They seek daily goals and should not be expected to track the underlying index over periods longer than one day. They are not suitable for all investors and should be utilized only by sophisticated investors who understand leverage risk and who actively manage their investments.
The FTSE China 50 Index (TXIN0UNU) consists of the 50 largest and most liquid public Chinese companies currently trading on the Hong Kong Stock Exchange as determined by FTSE/Russell.
The MSCI Emerging Market IndexSM (NDUEEGF) is a free float-adjusted market capitalization weighted index that is designed to represent the performance of large- and mid-capitalization securities across emerging markets countries.
The CSI 300 Index (CSIN0301) is a modified free-float market capitalization weighted index comprised of the largest and most liquid stocks in the Chinese A-share market. Index constituent stocks must have been listed for more than three months (unless the stock’s average daily A-share market capitalization since its initial listing ranks among the top 30 of all A-shares) and must not be experiencing obvious abnormal fluctuations or market manipulations.
The CSI Overseas China Internet Index (H11137) is provided by China Securities Index Co., LTD (the “Index Provider”). The Index is designed to measure the performance of the investable universe of publicly traded China-based companies whose primary business or businesses are in the Internet and Internet-related sectors, as defined by the Index Provider, and are listed outside of mainland China, including in Hong Kong.
One cannot directly invest in an index.
Direxion Shares Risks – An investment in a Fund involves risk, including the possible loss of principal. A Fund is non-diversified and includes risks associated with the Fund’s concentrating its investments in a particular industry, sector, or geography which can increase volatility. The use of derivatives such as futures contracts and swaps are subject to market risks that may cause prices to fluctuate over time.
Leverage Risk – Each Fund obtains investment exposure in excess of its net assets by utilizing leverage and may lose more money in market conditions that are adverse to its investment objective than a fund that does not utilize leverage. A total loss may occur in a single day. Leverage will also have the effect of magnifying any differences in the Fund’s correlation or inverse correlation with the Index and may increase the volatility of the Fund.
Daily Index Correlation Risk – A number of factors may affect the Bull Fund’s ability to achieve a high degree of correlation with the Index and therefore achieve its daily leveraged investment objective. The Bull Fund’s exposure to the Index is impacted by the Index’s movement. Because of this, it is unlikely that the Bull Fund will be perfectly exposed to the Index at the end of each day. The possibility of the Bull Fund being materially over- or under-exposed to the Index increases on days when the Index is volatile near the close of the trading day.
Daily Inverse Index Correlation Risk – A number of factors may affect the Bear Fund’s ability to achieve a high degree of inverse correlation with the Index and therefore achieve its daily inverse leveraged investment objective. The Bear Fund’s exposure to the Index is impacted by the Index’s movement. Because of this, it is unlikely that the Bear Fund will be perfectly exposed to the Index at the end of each day. The possibility of the Bear Fund being materially over- or under-exposed to the Index increases on days when the Index is volatile near the close of the trading day.
Chinese Securities Risk – Chinese securities are subject to the risks of government involvement, concentrated issuers, more frequent trading halts, low volume and volatility, higher dept levels, less-developed laws and regulations, being export driven and highly reliant on trade as well as security concerns, such as terrorism and strained international relations.
Financials Sector Risk — Performance of companies in the financials sector may be materially impacted by many factors, including but not limited to, government regulations, economic conditions, credit rating downgrades, changes in interest rates and decreased liquidity in credit markets.
Consumer Discretionary Sector Risk — Companies in the consumer discretionary sector are tied closely to the performance of the overall domestic and international economy, including the functioning of the global supply chain, interest rates, competition and consumer confidence.
Technology Sector Risk — The market prices of technology-related securities tend to exhibit a greater degree of market risk and sharp price fluctuations than other types of securities. These securities may fall in and out of favor with investors rapidly, which may cause sudden selling and dramatically lower market prices.
Additional risks of each Fund include Effects of Compounding and Market Volatility Risk, Market Risk, Counterparty Risk, Rebalancing Risk, Intra-Day Investment Risk, Other Investment Companies (including ETFs Risk), Cash Transaction Risk, Passive Investment and Index Performance Risk as well as Emerging Markets Risk, and for the Direxion Daily FTSE China Bear 3X Shares, Shorting or Inverse Risk. Please see the summary and full prospectuses for a more complete description of these and other risks of a Fund.
