
Editor's note: Any and all references to time frames longer than one trading day are for purposes of market context only, and not recommendations of any holding time frame. Daily rebalancing ETFs are not meant to be held unmonitored for long periods. If you don't have the resources, time or inclination to constantly monitor and manage your positions, leveraged and inverse ETFs are not for you.
After a multi-year bear market, shares of Chinese equities have finally sprung back to life. This rally could open the door to renewed opportunities for traders on the long side of the market, but in the event it is just a short squeeze, opportunities back to the short side should be considered as well.
Did China’s Stimulus Finally Pay Off?
For many months, it seemed that stimulus on behalf of the Chinese government and the PBOC (People’s Bank of China) was bearing little fruit. The Chinese market was in a sustained downtrend, forming lower-lows and lower-highs.
But this all began to change following the bottom back in January. Since then, the equity market has been on a tear to the upside, squeezing bears and forcing them to reconsider whether a new bull trend is in effect.
Just recently, the central bank announced that minimum mortgage payments will be lowered and the floor on minimum mortgage rates will be removed. The move is meant to help buoy a distressed property market, and not to mention, the central bank has already been cutting its benchmark rate.
Traders that think additional stimulus from policymakers in China could be a catalyst for additional upside in local equities may find a trade with Direxion’s Daily FTSE China Bull 3X Shares (Ticker: YINN), which seeks daily investment results, before fees and expenses, of 300% of the performance of the FTSE China 50 Index*.
Below is a daily chart of YINN as of May 17, 2024.
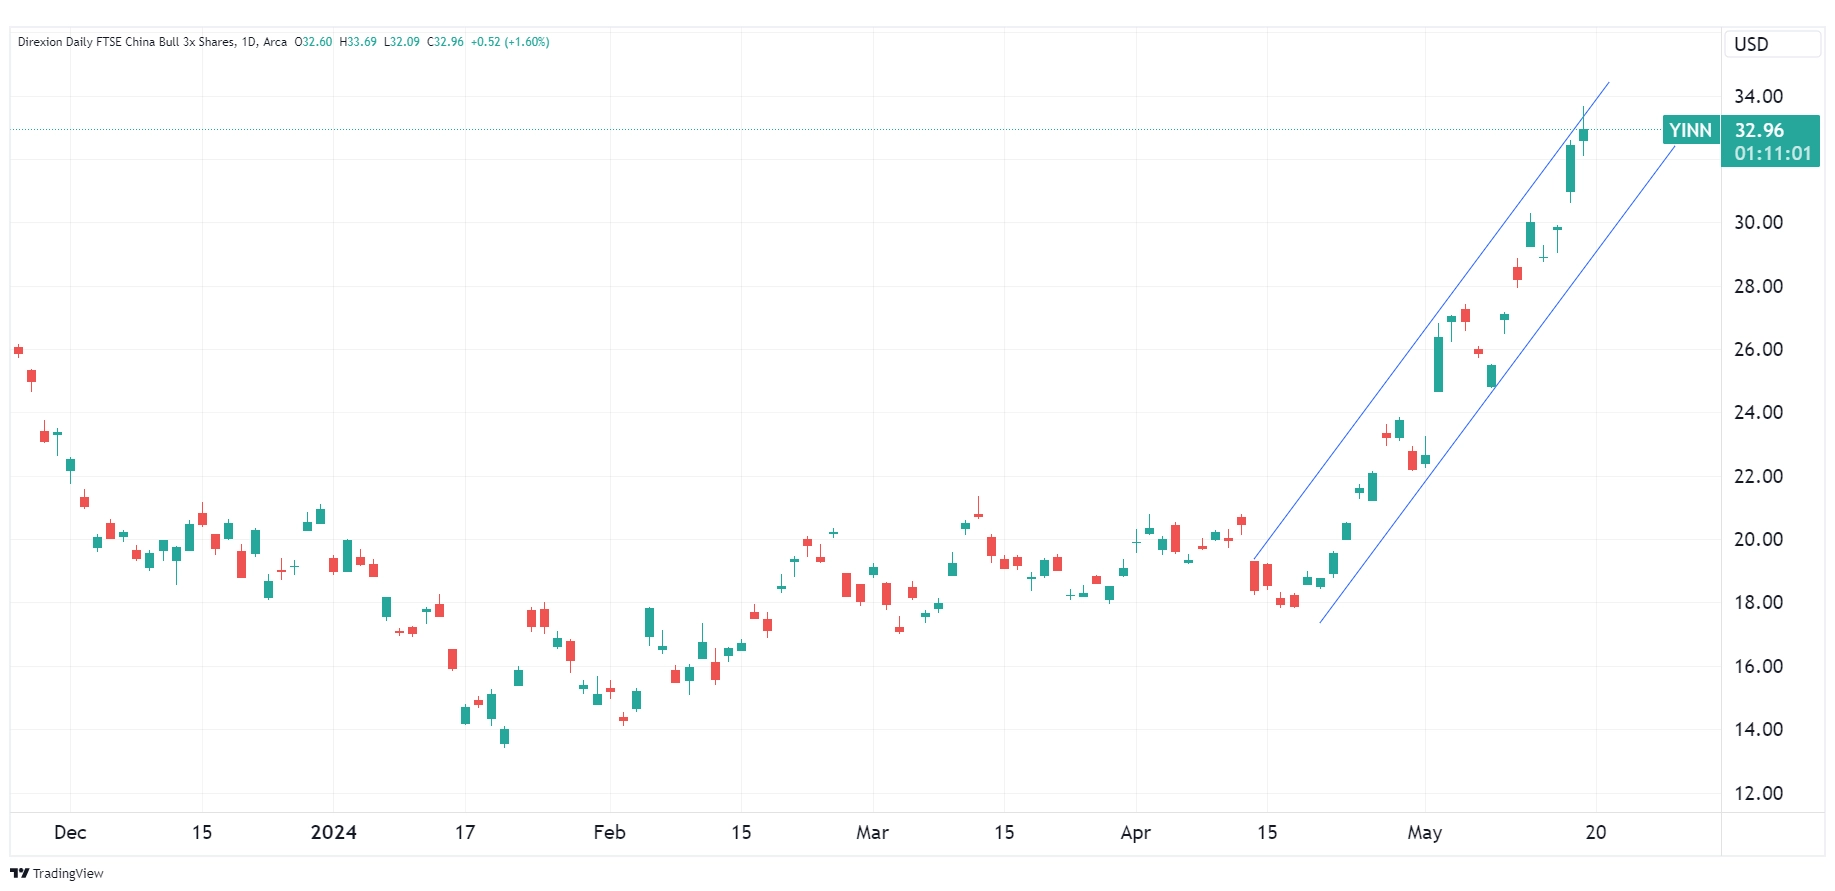
Source: TradingView.com
Candlestick charts display the high and low (the stick) and the open and close price (the body) of a security for a specific period. If the body is filled, it means the close was lower than the open. If the body is empty, it means the close was higher than the open.
The performance data quoted represents past performance. Past performance does not guarantee future results. The investment return and principal value of an investment will fluctuate. An investor’s shares, when redeemed, may be worth more or less than their original cost; current performance may be lower or higher than the performance quoted. For the most recent month-end performance go to Direxion.com/etfs. For standardized performance click here.
The slanted blue line represents an uptrend. An uptrend describes the price movement of a financial asset when the overall direction is upward.
What If More Pain Lies Ahead?
Despite the economic stimulus, the Chinese economy is still grappling with slowing consumption, which is a problem considering the growing consumer base in the country. It also seems that investment confidence is lacking as well as fixed asset investments came in below estimates.
Traders would be wise to keep an eye on the earnings reports for the following companies: Tencent Holdings (Ticker: TCEHY), Alibaba (Ticker: BABA), and Meituan (Ticker: MPNGY). These represent the three biggest holdings in the leveraged China fund, and if the next earnings reports come in below estimates, it could lead to a rebound in the Direxion Daily FTSE China Bear 3X Shares (Ticker: YANG), which seeks daily investment results, before fees and expenses, of 300% of the inverse (or opposite) of the performance of the FTSE China 50 Index*.
To view the Fund's full holdings, click here. Holdings are subject to risk and change.
Tencent’s next earnings report is on August 14, 2024, Alibaba’s next earnings report is on July 31, 2024, and Meituan’s next earnings report is on August 23, 2024.
Below is a daily chart of YANG as of May 17, 2024.
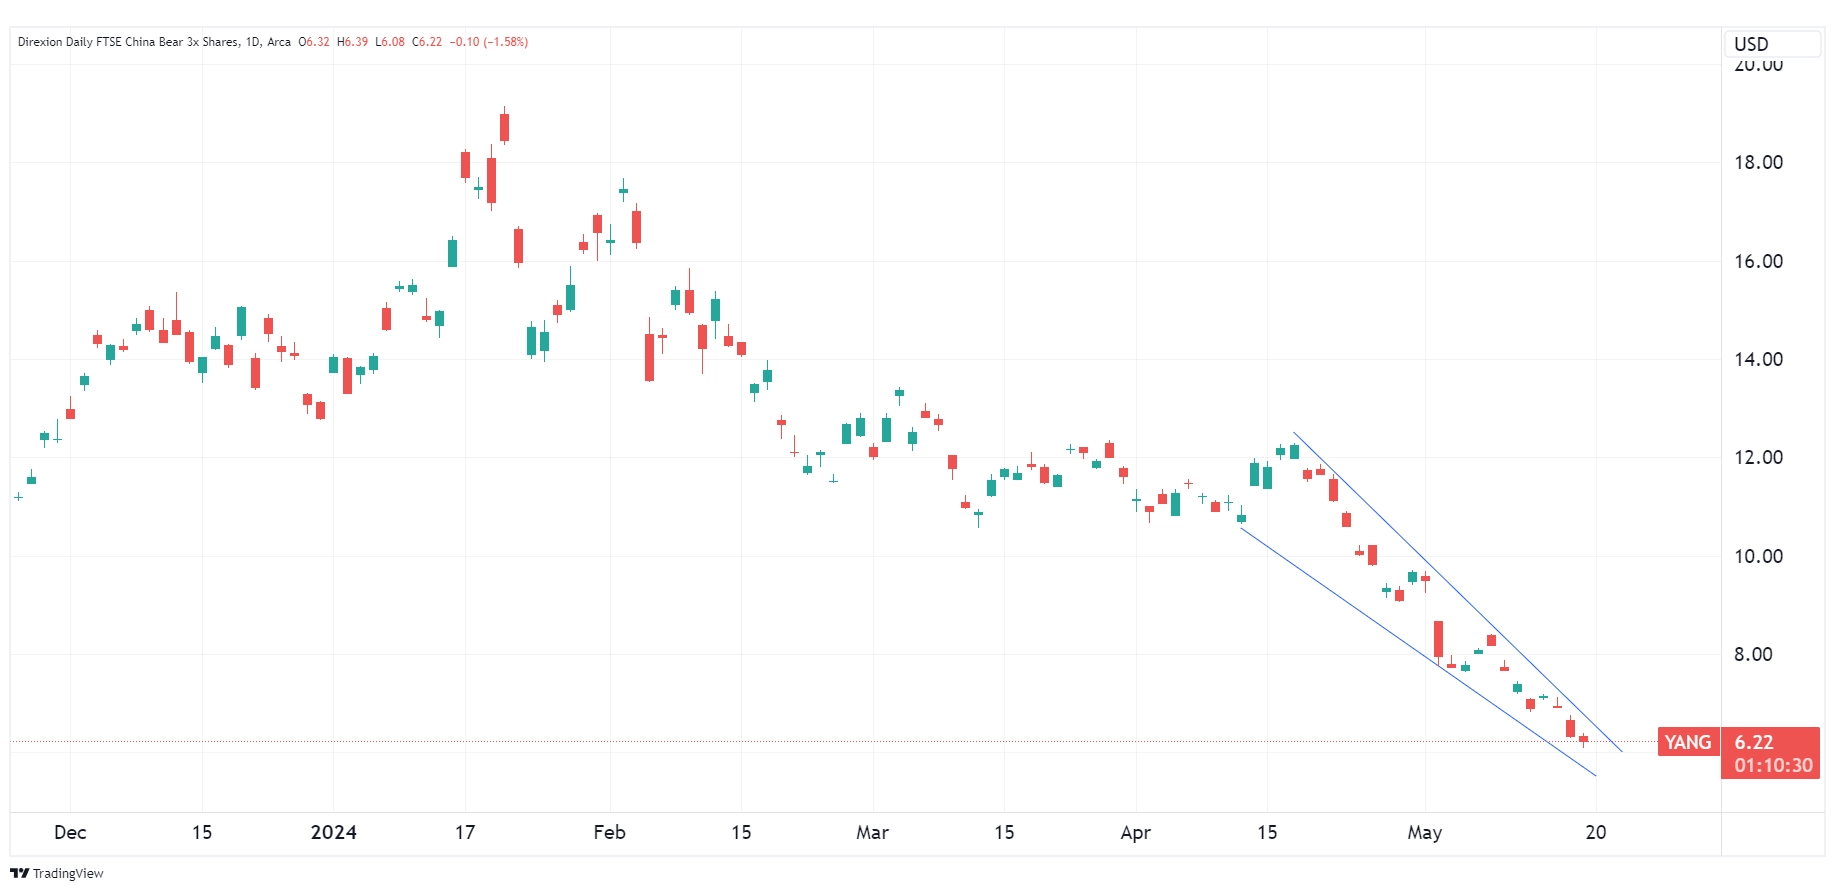
Source: TradingView.com
Candlestick charts display the high and low (the stick) and the open and close price (the body) of a security for a specific period. If the body is filled, it means the close was lower than the open. If the body is empty, it means the close was higher than the open.
The performance data quoted represents past performance. Past performance does not guarantee future results. The investment return and principal value of an investment will fluctuate. An investor’s shares, when redeemed, may be worth more or less than their original cost; current performance may be lower or higher than the performance quoted. For the most recent month-end performance go to Direxion.com/etfs. For standardized performance click here.
The slanted blue line represents a downtrend. A downtrend describes the price movement of a financial asset when the overall direction is downward.
Additional Overseas Speculative Opportunities
Traders looking for a broader approach to overseas trading may find an opportunity with Direxion’s emerging market funds. The Direxion Daily MSCI Emerging Markets Bull 3X Shares (Ticker: EDC), and the Direxion Daily MSCI Emerging Markets Bear 3X Shares (Ticker: EDZ) seek daily investment results, before fees and expenses, of 300%, and -300%, respectively, of the performance of the MSCI Emerging Markets Index*. Traders looking for long-side emerging market opportunities without China may consider the Direxion Daily MSCI Emerging Markets ex China Bull 2X Shares (Ticker: XXCH), which seeks daily investment results, before fees and expenses, of 200% of the performance of the MSCI Emerging Markets ex China Index*.
For those looking for more concentrated bets within China, the Direxion Daily CSI China Internet Index Bull 2X Shares (Ticker: CWEB), which seeks daily investment results, before fees and expenses, of 200% of the performance of the CSI Overseas China Internet Index*, may provide a unique opportunity.
*Definitions and Index Descriptions
An investor should carefully consider a Fund’s investment objective, risks, charges, and expenses before investing. A Fund’s prospectus and summary prospectus contain this and other information about the Direxion Shares. To obtain a Fund’s prospectus and summary prospectus call 866-476-7523 or visit our website at direxion.com. A Fund’s prospectus and summary prospectus should be read carefully before investing.
Leveraged and Inverse ETFs pursue daily leveraged investment objectives which means they are riskier than alternatives which do not use leverage. They seek daily goals and should not be expected to track the underlying index over periods longer than one day. They are not suitable for all investors and should be utilized only by sophisticated investors who understand leverage risk and who actively manage their investments.
The FTSE China 50 Index (TXIN0UNU) consists of the 50 largest and most liquid public Chinese companies currently trading on the Hong Kong Stock Exchange as determined by FTSE/Russell.
The MSCI Emerging Markets IndexSM (NDUEEGF) is a free float-adjusted market capitalization weighted index that is designed to represent the performance of large- and mid-capitalization securities across emerging markets countries.
The MSCI Emerging Markets ex China Index is designed to capture the large- and mid-capitalization securities across 23 of the 24 emerging markets (with the exception of China) as defined by MSCI Inc. The Index is market cap weighted and covers approximately 85% of the free float-adjusted market capitalization in each of the selected countries.
The CSI Overseas China Internet Index (H11137) is provided by China Securities Index Co., LTD (the “Index Provider”). The Index is designed to measure the performance of the investable universe of publicly traded China-based companies whose primary business or businesses are in the Internet and Internet-related sectors, as defined by the Index Provider, and are listed outside of mainland China, including in Hong Kong.
One cannot directly invest in an index.
Direxion Shares Risks – An investment in each Fund involves risk, including the possible loss of principal. Each Fund is non-diversified and includes risks associated with the Funds’ concentrating their investments in a particular industry, sector, or geographic region which can result in increased volatility. The use of derivatives such as futures contracts and swaps are subject to market risks that may cause their price to fluctuate over time. Risks of each Fund include Effects of Compounding and Market Volatility Risk, Leverage Risk, Market Risk, Counterparty Risk, Rebalancing Risk, Intra-Day Investment Risk, Other Investment Companies (including ETFs) Risk, Cash Transaction Risk, Passive Investment and Index Performance Risk, and risks specific to Chinese securities. The Chinese economy is generally considered an emerging market and can be significantly affected by economic and political conditions and policy in China and surrounding Asian countries. Securities from issuers in emerging markets face the potential for greater market volatility, lower trading volume, higher levels of inflation, political and economic instability, greater risk of market shutdown and more government limitations on foreign investments than typically found in more developed markets. Additional risks include, for the Direxion Daily FTSE China Bull 3X Shares, Daily Index Correlation Risk and for the Direxion Daily FTSE China Bear 3X Shares, Shorting or Inverse Risk and Daily Inverse Index Correlation Risk. Please see the summary and full prospectuses for a more complete description of these and other risks of each Fund.