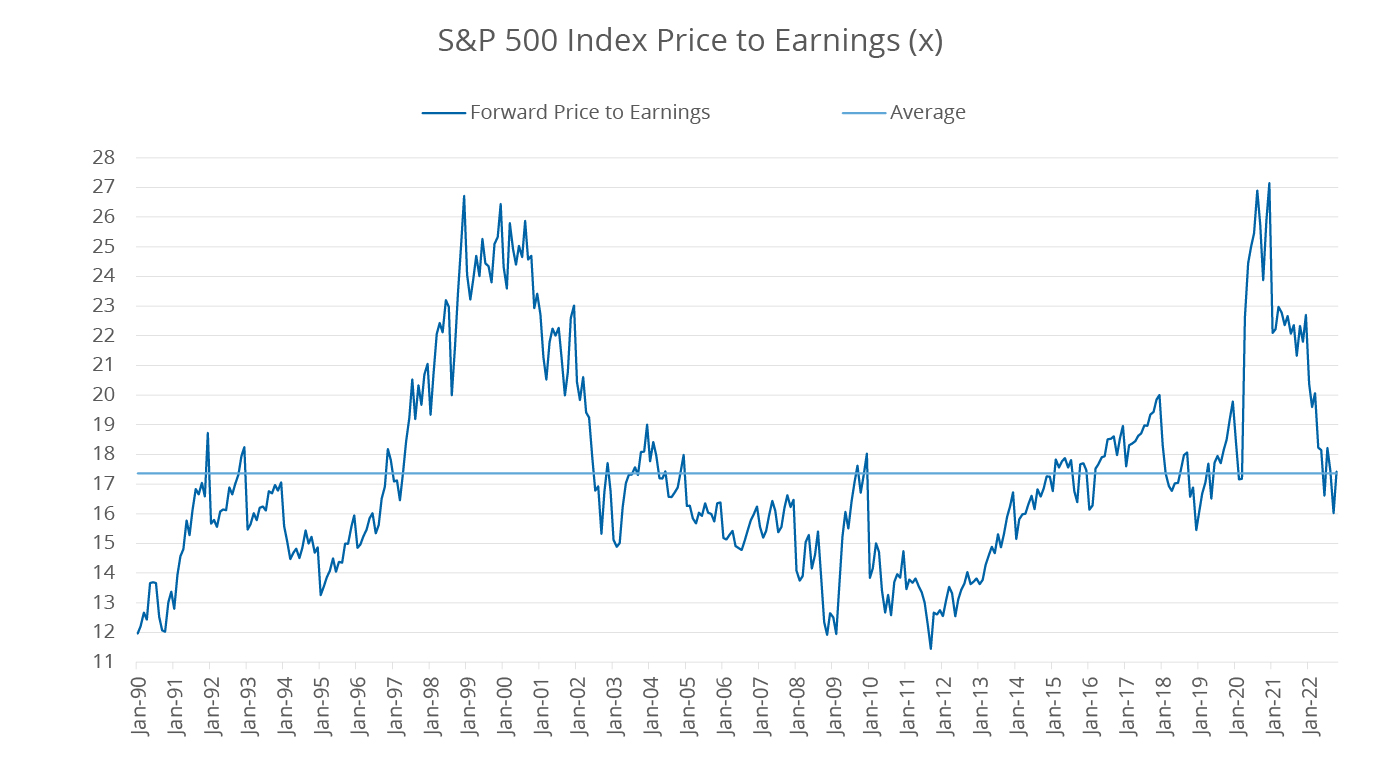
October offered a reprieve to stocks, with global equities rallying 6%. Even so, that barely made a dent in this year’s decline, especially after an awful September. Unfortunately for bulls, much of last month’s gains seem to be driven by a reversal of what became extreme bearish sentiment. Macro headwinds, including rising inflation, higher interest rates, and slower economic growth remain, muddying the outlook. Even as earnings this quarter have not been as negative as recent quarters, the decline in valuations has been sharp. This conflicting backdrop offers narratives for both bulls and bears to feast on.
Stock Market Multiples have Collapsed.

Source: S&P Dow Jones, as of October 31, 2022.
Trouble Ahead. Trouble Behind.
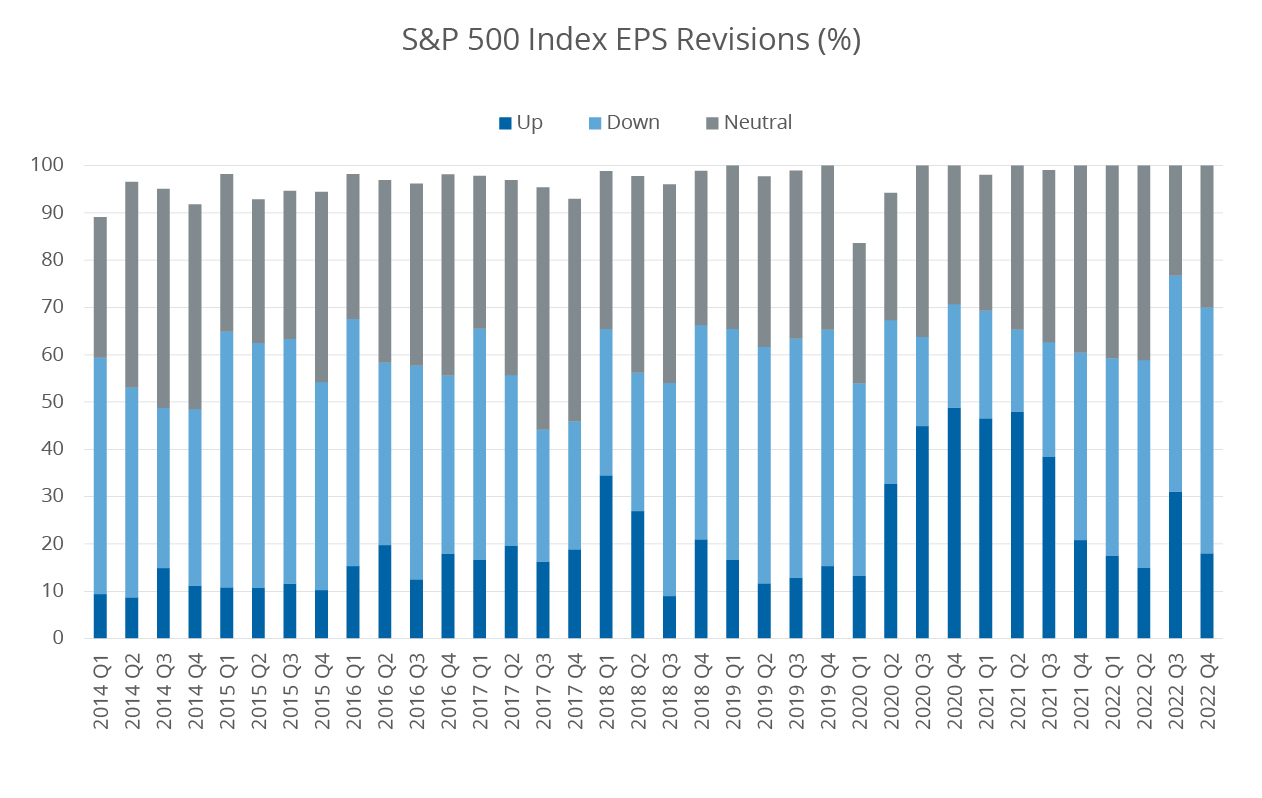
Let’s dive into the state of multiples and earnings a bit more. Market participants start bidding down stocks before economic contractions or outright recessions as they look ahead to future weakness in corporate earnings. According to Citi, the average contraction of the last seven periods of earnings per share (EPS)* recessions has been 31%.1 While this time may be different, analysts only started cutting estimates in July. They remain overly optimistic on earnings based on historical precedent and are expecting 6 to 7% growth in the aggregate 2023 to 2024. Once material cuts occur, the market may potentially react poorly in the face of reality. The one area that is seeing degradation is the ratio of EPS revisions, with upgrades collapsing relative to downgrades.
Analysts are not Cutting Earnings Estimates Enough.

Source: Bloomberg Finance, L.P., as of October 31, 2022. Note totals may not add to 100%.
Slow Train.
Looking toward the remainder of the year, the direction of the Fed seems likely to remain the main driver of market action. Underpinning the Fed’s path will be how quickly inflation moderates and how sharply economic growth contracts thanks to higher rates. Last week, the Fed hiked rates an additional 0.75% for the fourth straight time, lifting the upper end of the Fed Funds Rate to 4.00%. While inflation may have peaked, the Fed is not in a position to declare victory and will likely need to keep their foot on the gas even if they moderate from the 0.75% level. Chairman Powell said as much during the most recent Federal Open Market Committee (FOMC) presser and made it clear there will not be a pivot coming anytime soon.
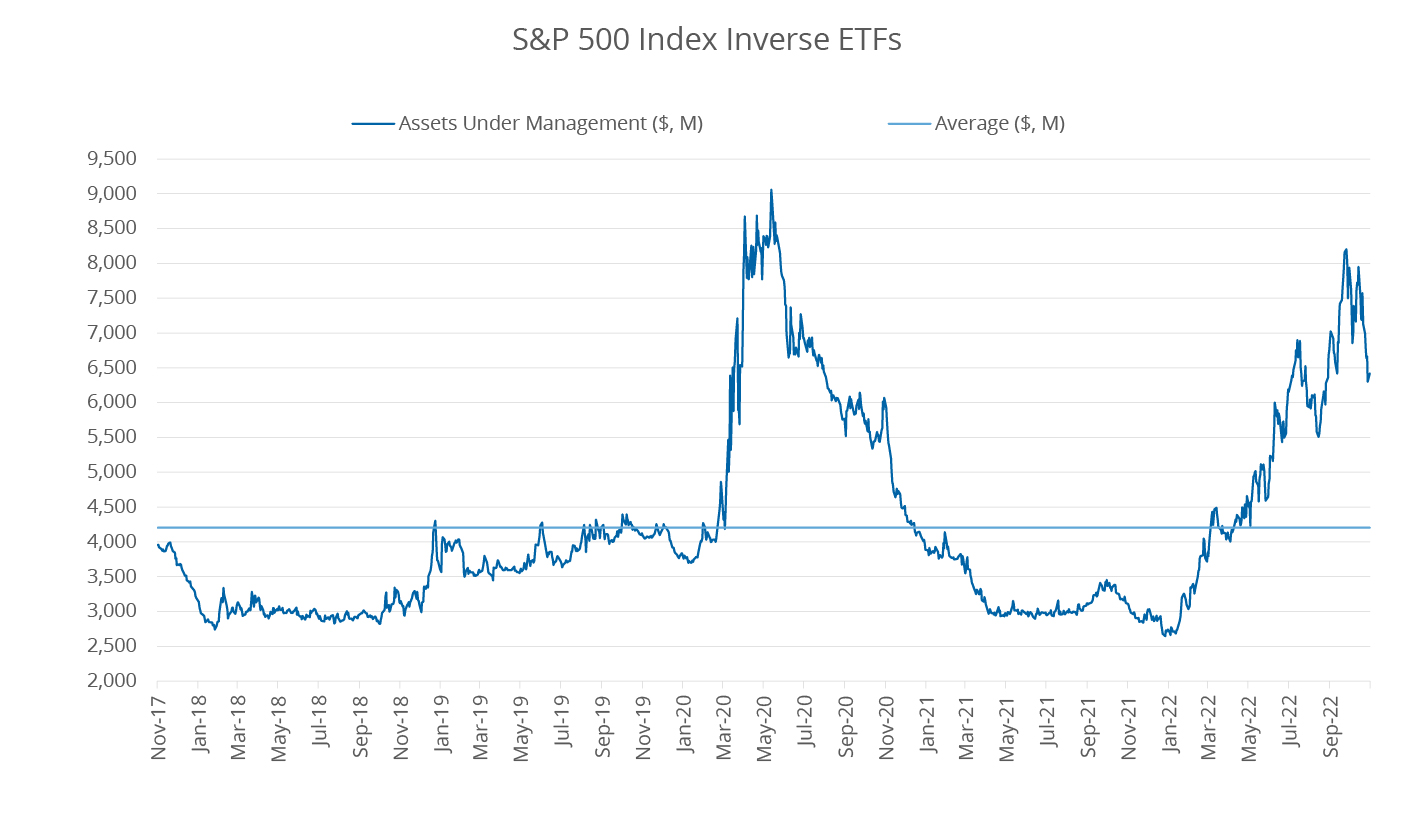
With cash offering attractive yields for the first time in a decade, some may be tempted to hide out there. Others may be dollar cost averaging into every downturn this year and are feeling the pain of the buy-the-dip-gone-bad. Others, especially those with a traders’ mindset, may want to consider opportunities to hedge their portfolios. That sentiment has driven considerable interest in inverse ETFs, especially those that offer exposure to the S&P 500 Index.* Inverse ETFs have seen their assets and value traded skyrocket in 2022, rivaling levels last year in the depths of the COVID market crash. If volatility persists, we can expect this trend to continue as market participants look toward solutions to navigate today’s challenging market environment.
Inverse ETF Assets have Exploded.

Source: Bloomberg, L.P., as of October 31, 2022. Data represents the assets under management of US-listed S&P 500 Inverse ETFs.
1 Citi Global Equity Strategy: EPS Recession - What's Priced In? Published 11/3/2022.
*Definitions
- Earnings per share (EPS) is a company's net profit divided by the number of common shares it has outstanding. EPS indicates how much money a company makes for each share of its stock and is a widely used metric for estimating corporate value.
- S&P 500® Index: Standard & Poor’s® selects the stocks comprising the S&P 500® Index on the basis of market capitalization, financial viability of the company and the public float, liquidity and price of a company’s shares outstanding. The Index is a float-adjusted, market capitalization-weighted index. One cannot directly invest in an index.
An investor should carefully consider a Fund’s investment objective, risks, charges, and expenses before investing. A Fund’s prospectus and summary prospectus contain this and other information about the Direxion Shares. To obtain a Fund’s prospectus and summary prospectus call 866-476-7523 or visit our website at www.direxion.com. A Fund’s prospectus and summary prospectus should be read carefully before investing.
Direxion Shares ETF Risks - An investment in the ETFs involves risk, including the possible loss of principal. The ETFs are non-diversified and include risks associated with concentration that results from an ETF’s investments in a particular industry or sector, which can increase volatility. The leveraged and inverse ETF utilize derivatives, such as futures contracts and swaps which are subject to market risks that may cause their price to fluctuate over time. The leveraged and inverse ETFs do not attempt to, and should not be expected to, provide returns which are a multiple of the return of their respective index for periods other than a single day. The leveraged and inverse ETFs may also subject to leverage, correlation, daily compounding, market volatility and risks specific to an industry or sector. The non-leveraged ETFs are subject to certain risks, including imperfect index correlation and market price variance, which may decrease performance. The non-leveraged ETFs may invest in a relatively small number of issuers and, as a result, be subject to greater risk of loss with respect to its portfolio securities. The non-leveraged ETFs may experience greater fluctuation in its net asset value as compared to other investments. The non-leveraged ETFs may be appropriate for investors with a long-term investment time horizon, who primarily seek capital growth, and who are able to tolerate periods of prolonged price declines. Please read each ETF’s prospectus for a more complete description of the investment risks. There is no guarantee that an ETF will achieve its investment objective.
