Something Always Breaks
While that statement may be a bit hyperbolic, nearly every time the Federal Reserve embarks on a tightening cycle, an asset breaks soon thereafter. Whether it be the Mexican peso crisis in 1994, the housing bubble burst in 2008, or the cryptocurrency crash in 2022, these events all occurred after the Fed raised rates. In the first half of this year, the carnage hit stocks too, with the S&P 500 down 20%, the Russell 2000 dropping over 23%, and the NASDAQ falling over 29%. The 10-year Treasury yield is up 1.58% and 2-Year Treasuries are up 2.67%, driving a flattening of the yield curve.
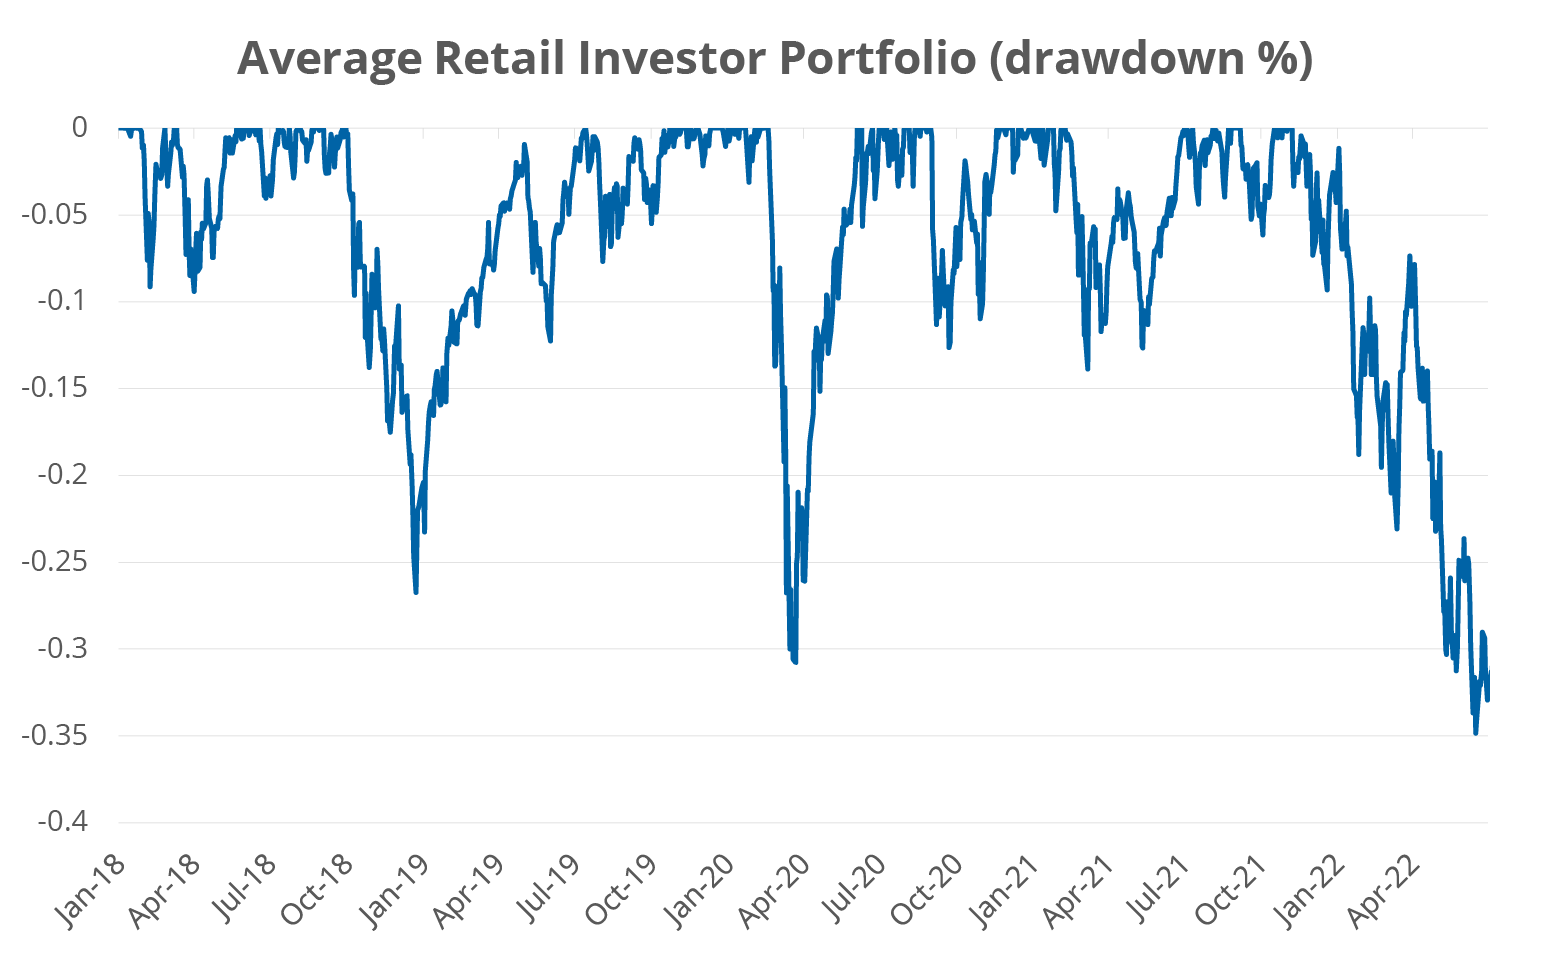
As a result, investor sentiment is the worst it has been since 20081, with even the more risk-on retail investors growing concerned, as evidenced in the figure below compiled by data provider VandaTrack. The impact of losses on investments coupled with a barrage of negative headwinds has shifted overall investor strategy from “buying the dip” to, “waiting and seeing.”
Retail Investors are Getting Crushed

Source: VandaTrack, as of June 30, 2022.
Inflation Much?
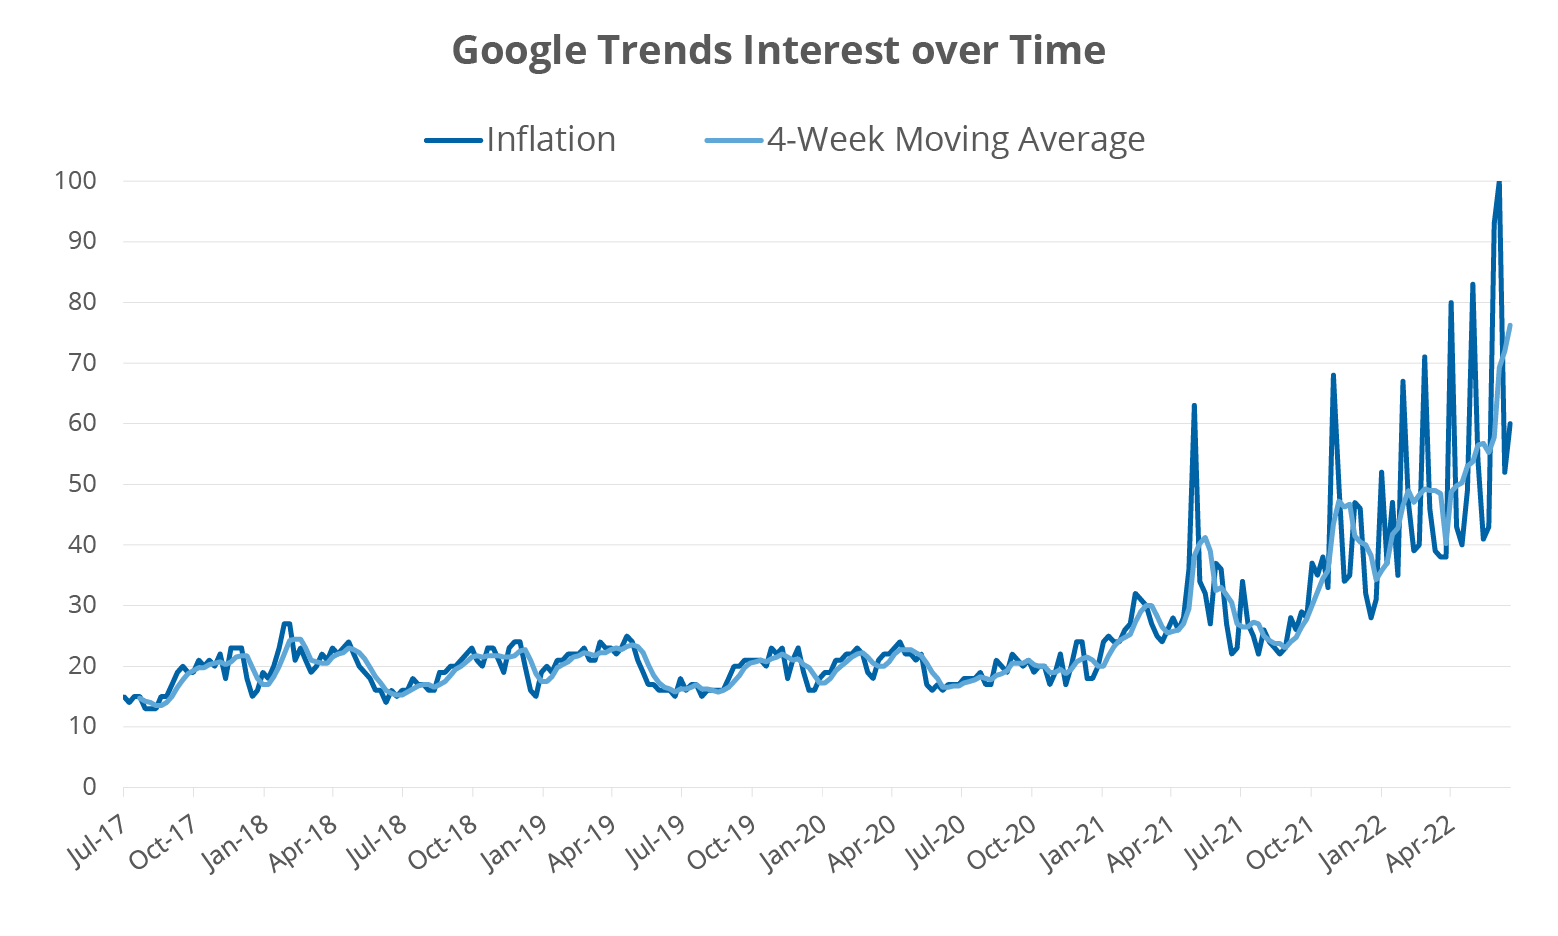
Inflation has been a mounting concern for investors. In fact, the U.S. inflation rate hit a 40-year high of 9.1% in June, higher than the consensus 8.8% estimate. Google searches for the word “inflation” have jumped remarkably over the past five years, illustrated in the figure below. Concerns over inflation and its impact on economic growth may be translating to a more cautious investment approach, as there seems to be no end in sight in the short term, despite the Federal Reserve’s recent attempts.
Searches for Inflation have Skyrocketed

Source: Google Trends, as of June 30, 2022.
Watch Corporate Bonds
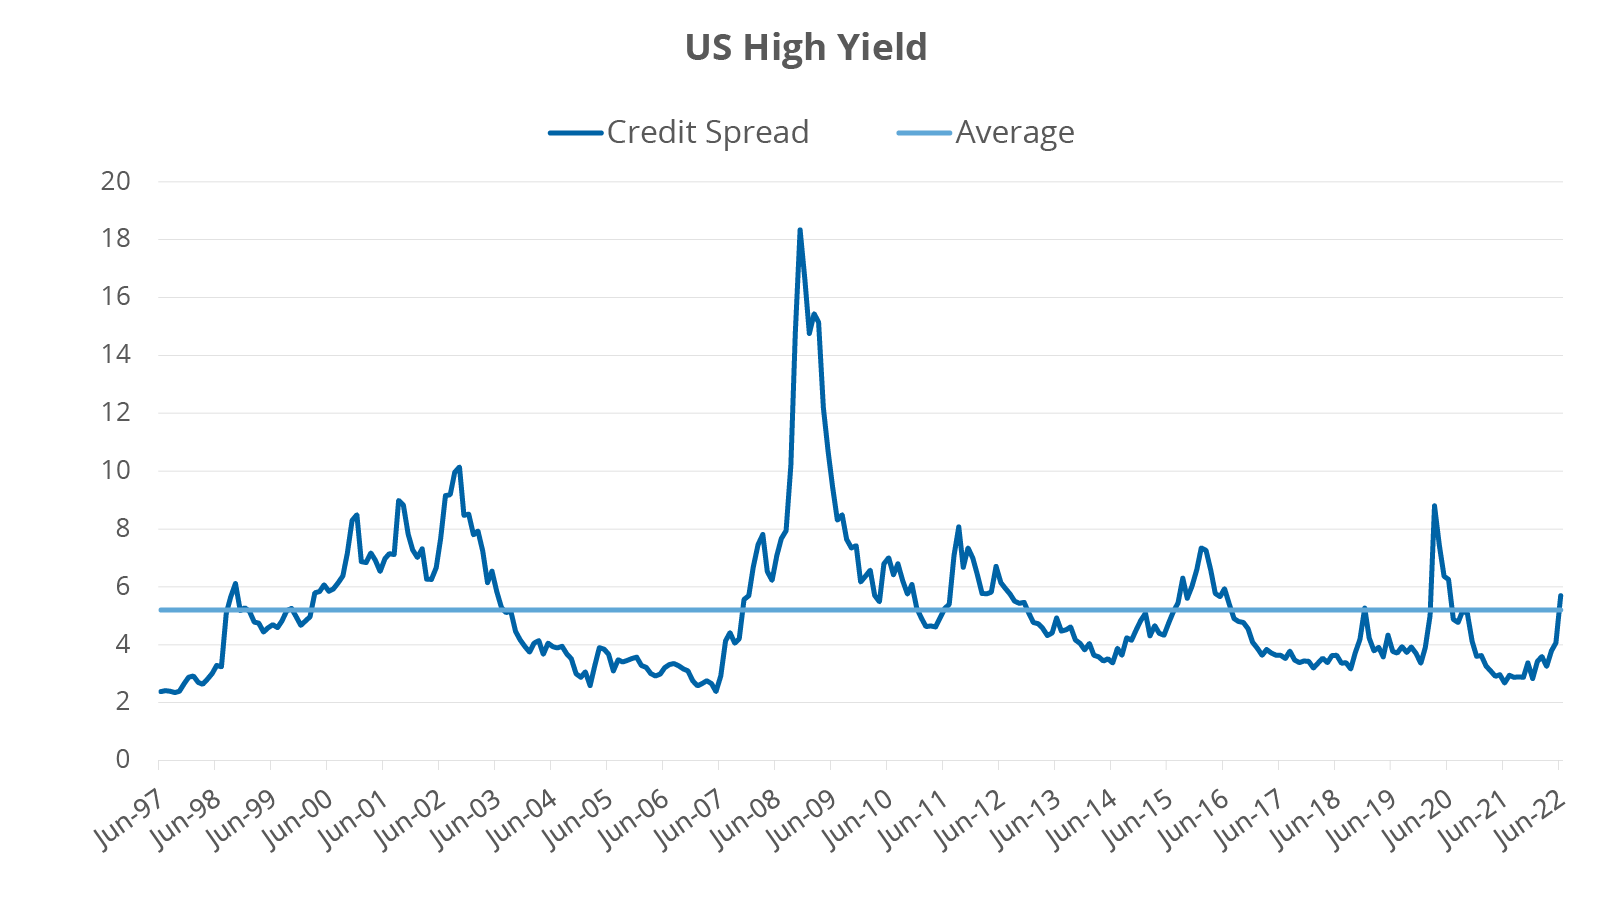
As a sign of further risk-off sentiment, credit spreads for high yield bonds (also known as below investment grade bonds) have widened and now stand close to their 25-year average. High yield bonds are often considered one of the leading economic indicators given their dependence on the financial health of corporations. Moody’s and S&P both predict that the default rate for corporate bonds will reach roughly 3% over the next year, which is greater than the current trailing 12-month rate of 2.1%. Although high yield corporates are the riskiest of the bond bunch, they are still considered a less-risky alternative to stocks. Regardless, many investors are ditching both corporate bonds and equities for safe haven assets such as government bonds and cash. A recent Bank of America survey found that investors are holding more than 6% cash in their portfolios, which is the highest level since October 2001.
Corporate Credit Spreads have Widened

Source: Bloomberg Finance, L.P., as of June 30, 2022. High Yield represented by the Bloomberg US Corporate High Yield Index.
What’s Next?
Investors and traders are weighing the risks of stagflation2 or actual deflation before making investment decisions. Investors need some sort of policy shift that indicates a bullish market is on the horizon, but central banks just turned hawkish, implying that the market problems will not resolve themselves. The Federal Reserve will continue on its tightening plan to bring down inflation. In previous tightening cycles, the Federal Reserve pushed the Fed Funds Rate to the level of the Consumer Price Index (CPI), but the elevated CPI today makes this tactic nearly impossible. Today, there remains a 7.5% spread between CPI and the Fed Funds Rate, indicating that stocks and other risky assets will likely remain under pressure. Any of these factors alone would not be abnormal, but when put together, we are experiencing a very unique market environment that has led to investors second guessing whether they should once again buy the dip.
One way to not simply wait and see is looking toward the Direxion Daily S&P 500 Bear 1X Shares (NYSE: SPDN). SPDN can be utilized as a satellite position within a portfolio’s equity allocation, as a means of reducing beta in a tumultuous market. It allows investors and traders to limit their exposure to the S&P 500 without necessarily forcing them to sell out of long held positions and is a cost efficient tool to obtain inverse exposure to the S&P 500. However, with any inverse ETF, it should only be used when someone has the ability to make a buy, sell, or hold decision on a daily basis.
[1]BofA Global Fund Manager Survey, as of July 19, 2022.
[2]Stagflation is characterized by slow economic growth, which is accompanied by rising prices (inflation).
Inverse ETFs are designed to move in the opposite direction of their benchmarks on a daily basis, and should not be expected to track their underlying indexes over periods longer than one day. They are not suitable for all investors and should be utilized only by investors who understand the consequences of seeking daily inverse investment results and intend to actively manage their investments.
An investor should carefully consider a Fund’s investment objective, risks, charges, and expenses before investing. A Fund’s prospectus and summary prospectus contain this and other information about the Direxion Shares. To obtain a Fund’s prospectus and summary prospectus call 866-476-7523 or visit our website at www.direxion.com. A Fund’s prospectus and summary prospectus should be read carefully before investing.
An investment in the Fund involves risk, including the possible loss of principal. The Fund is non-diversified and includes risks associated with the Fund concentrating its investments in a particular industry, sector, or geographic region which can result in increased volatility. The use of derivatives such as futures contracts and swaps are subject to market risks that may cause their price to fluctuate over time. Risks of the Fund include Effects of Compounding and Market Volatility Risk, Market Risk, Market Disruption Risk, Aggressive Investment Techniques Risk, Counterparty Risk, Shorting Risk, Cash Transaction Risk, Intra-Day Investment Risk, Daily Inverse Index Correlation/Tracking Risk, and risks specific to the securities that comprise the S&P 500® Index. Please see the summary and full prospectuses for a more complete description of these and other risks of the Fund.
