The Daily Objective
Each Direxion Daily Leveraged or Inverse 3X ETF seeks daily leveraged investment results, before fees and expenses, of 300%, or 300% of the inverse (or opposite), of the return a respective target benchmark index (“target index”) for a single day. (The terms “day,” “daily,” and “trading day” are the period from the close of the markets on one trading day to the close of the markets on the next trading day).
A bull fund seeks 300% of the performance of its benchmark index (“Bull Fund”) and a bear fund seeks 300% of the inverse (or opposite) of its benchmark index (“Bear Fund”). There is no guarantee that the funds will achieve their investment objective.
A Moving Target
Intra-day, the total exposure of a Fund may be higher or lower than the stated daily investment objective depending on the movement of the target index away from its value at the end of the prior trading day.
After a move in the target index that is favorable to the fund - either up for a Bull Fund or down for a Bear Fund - total exposure will decline below the daily stated investment objective. Conversely, if the value of the target index moves in a direction that is unfavorable to a Fund - either down for a Bull Fund or up for a Bear Fund - total exposure would rise above the daily stated investment objective. This occurs because, although the net asset levels of a Fund and the total exposure to the target index move directionally together, the percentage change in net assets exceeds the percentage change in exposure.
On days when market fluctuation is minimal, the intra-day changes to exposure levels are small. However, on days when there is substantial fluctuation in the value of the target index, the intra-day changes to exposure levels could be greater. Direxion Daily Leveraged & Inverse 3X ETFs are intended to be used as short-term trading vehicles.
Figure 1: Hypothetical Example (A Daily Bull 3X Fund)
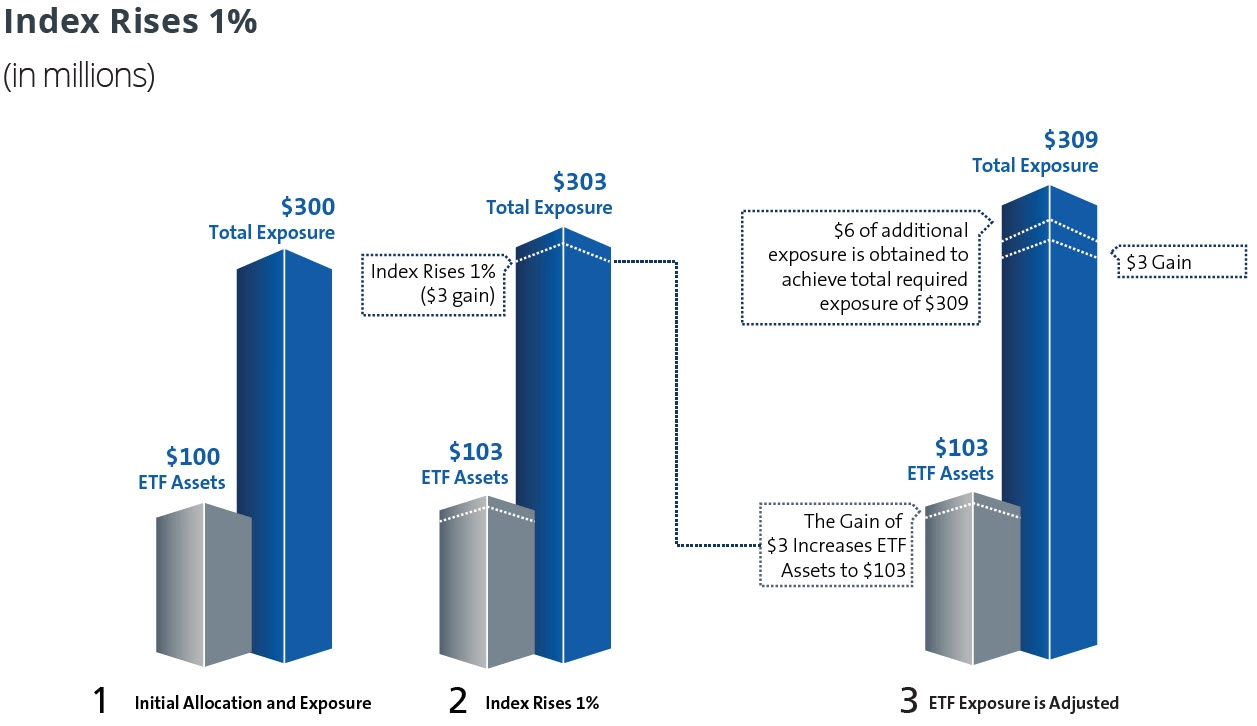
- Initial Allocation and Exposure: If a 3X ETF has $100 million in net assets, $300 million of net exposure to the fund’s underlying index must be maintained.
- Index Rises 1%: If the index increases by 1% in a trading day, the gross exposure would rise to $303 million and net assets would rise to $103 million, resulting in a $3 million gain.
- ETF Exposure Adjusted: Since gross exposure must always equal 300% of net assets ($103 million in net assets x 300% = $309 million), $6 million of exposure must be added to the portfolio.
Figure 2: Hypothetical Example (A Daily Bull Bull 3X Fund
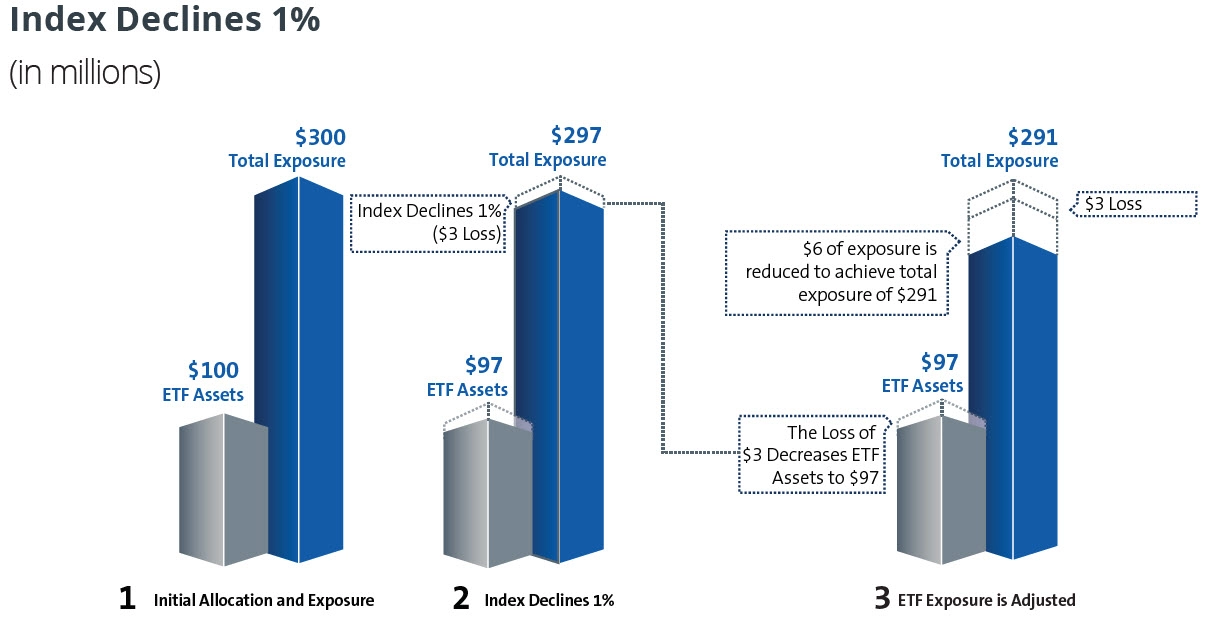
- Initial Allocation and Exposure: If a 3X ETF has $100 million in net assets, $300 million of net exposure to the fund’s underlying index must be maintained.
- Index Declines 1%: If the index decreases by 1% in a trading day, the gross exposure would decline to $297 million and net assets would decline to $97 million, resulting in a $3 million loss.
- ETF Exposure Adjusted: Since gross exposure must always equal 300% of net assets ($97 million in net assets x 300% = $291 million), $6 million of exposure must be removed from the portfolio.
Bull and Bear Funds: Target Index Moves and Resulting Exposure Levels
The table below shows how, for a 3X Bull Fund, a decline in the target index results in increased exposure and a gain in the target index results in decreased exposure.
| Bull 3X Fund Index Move | Resulting Exposure |
| -5% | 335% |
| -4% | 327% |
| -3% | 320% |
| -2% | 313% |
| -1% | 306% |
| 0% | 300% |
| 1% | 294% |
| 2% | 289% |
| 3% | 283% |
| 4% | 279% |
| 5% | 274% |
The table below shows how, for a 3X Bear Fund, a decline in the target index results in decreased exposure and a gain in the target index results in increased exposure.
| Bear 3X Fund Index Move | Resulting Exposure |
| -5% | 248% |
| -4% | 257% |
| -3% | 267% |
| -2% | 277% |
| -1% | 288% |
| 0% | 300% |
| 1% | 312% |
| 2% | 326% |
| 3% | 340% |
| 4% | 355% |
| 5% | 371% |
How to Monitor Intra-Day NAV Values (iNAV)
Investors should monitor the difference between the current market value of a Direxion Daily Leveraged or Inverse 3X ETF and the most recently calculated closing NAV in order to determine actual exposure levels at the time of purchase. The best way to understand an ETF’s intra-day market value is to monitor a data point known as the ‘iNAV.’ The iNAV is calculated by various data providers and can be accessed in real time (roughly every 15 seconds) throughout the trading day. The iNAV is a very good indication of what a fund’s actual NAV per share would be if it were calculated at that point in time. The iNAV can be accessed on various data systems and websites by typing “^[ETF symbol]-IV” into the quote request field. For example, to find the iNAV for the Direxion Daily Technology Bull 3X Shares (TECL), type ^TECL-IV. Investors can compare the iNAV of an ETF to its most recently calculated NAV and calculate their expected exposure level prior to purchasing the fund. This will help set performance expectations properly.
Daily Hypothetical $10,000 Investment Scenarios
The following examples show various scenarios on how intra-day movements can impact shareholders’ exposure levels for Daily Bull and Bear 3X Funds. Hypothetical examples do not reflect the impact of expenses, such as commission charges and taxes, which would lower the results shown.
Scenario #1: Bull Fund Purchased at an Increased Exposure Level
The target index, which closed the previous night at $100, decreases to $99 by 10:00AM. An investor that purchases the fund at this point would obtain exposure to the index in the amount of 306%, not 300%. After the purchase, the target index moves from $99 to $102 (3.10% return) at 2:00PM, at which point the investor sells. During this same period, the Bull Fund’s intraday NAV rises from $97 to $106, a gain of 9.30%, which is 306% of the target index move.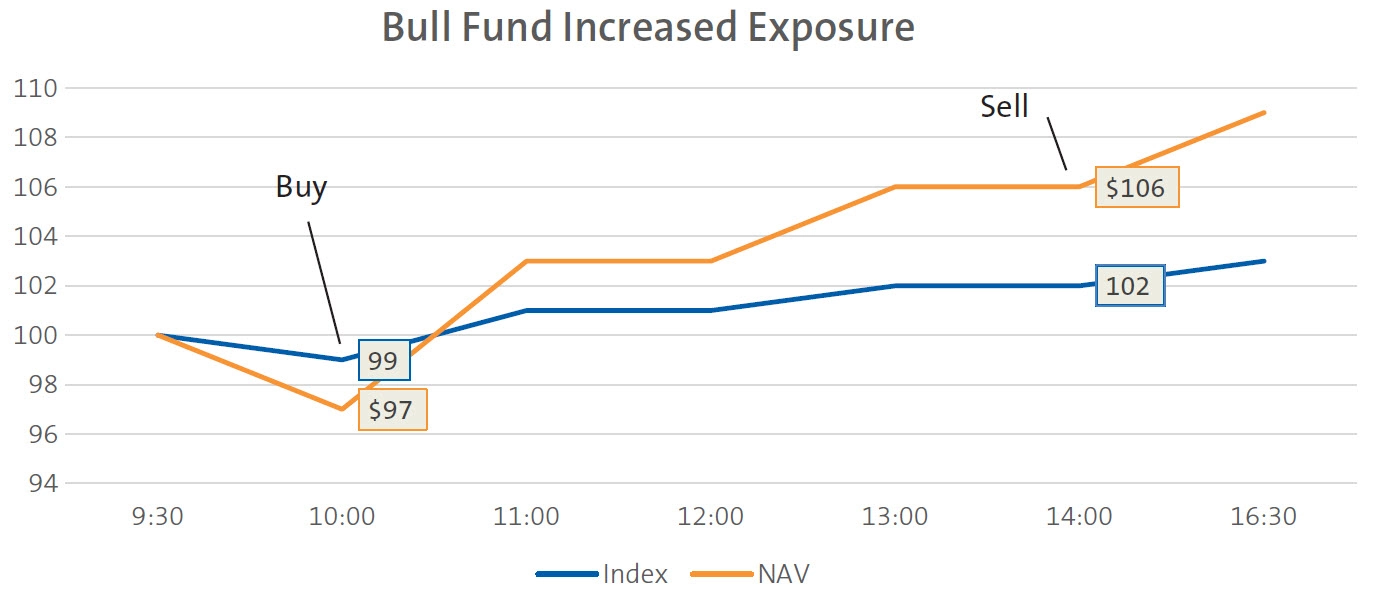
| Time of Purchase | 10:00 AM |
| Index Value | 99 |
| Bull NAV | $97 |
| Bull Exposure | 306% |
| Initial Investment | $10,000 |
| Time of Sale | 2:00 PM |
| Index Value | 102 |
| Bull NAV | $106 |
| Fund Return | 9.30% |
| Index Return | 3.10% |
| Fund/Index Return | 306% |
| Investment at Sale | $10,930 |
Scenario #2: Bull Fund Purchased at a Decreased Exposure Level
In the first ½ hour of the trading day, the target index gained 1% (moved from 100 to 101). An investor that purchases the fund at 10:00AM, at an intraday NAV of $103, would obtain exposure to the target index in the amount of 294%, not 300%. After the purchase, the target index moves from 101 to 102 (0.99% return) at 2:00PM, at which point the investor sells. During this same period, the Bull Fund’s intraday NAV increases to $106, a gain of 2.91%, which is 294% of the target index move.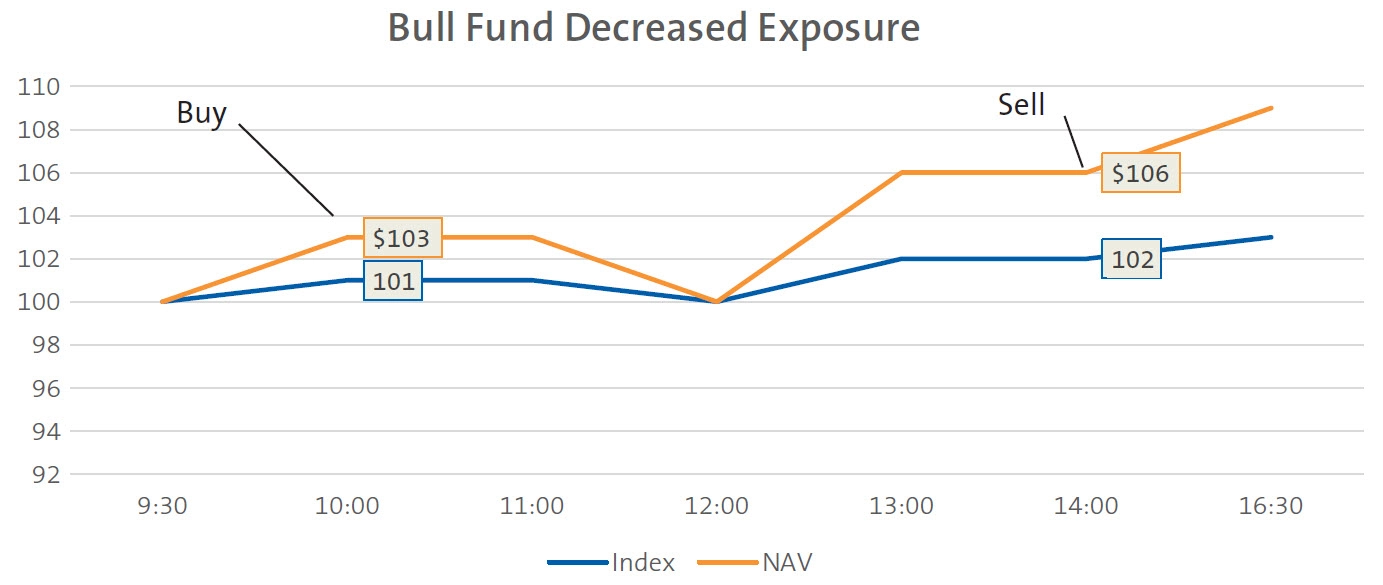
| Time of Purchase | 10:00 AM |
| Index Value | 101 |
| Bull NAV | $103 |
| Bull Exposure | 294% |
| Initial Investment | $10,000 |
| Time of Sale | 2:00 PM |
| Index Value | 102 |
| Bull NAV | $106 |
| Fund Return | 2.91% |
| Index Return | 0.99% |
| Fund/Index Return | 294% |
| Investment at Sale | $10,291 |
Scenario #3: Bear Fund Purchased at an Increased Exposure level
In the first ½ hour of the trading day, the target index gained 1% (moved from 100 to 101). An investor that purchases the fund at 10:00AM, at an intraday NAV of $97, would obtain inverse exposure to the target index in the amount of 306%, not 300%. After the purchase, the target index moves from 101 to 102 (0.99% return) at 2:00PM, at which point the investor sells. During this same period, the Bear Fund’s intraday NAV decreases to $94, a loss of -3.03%, which is -306% of the index move.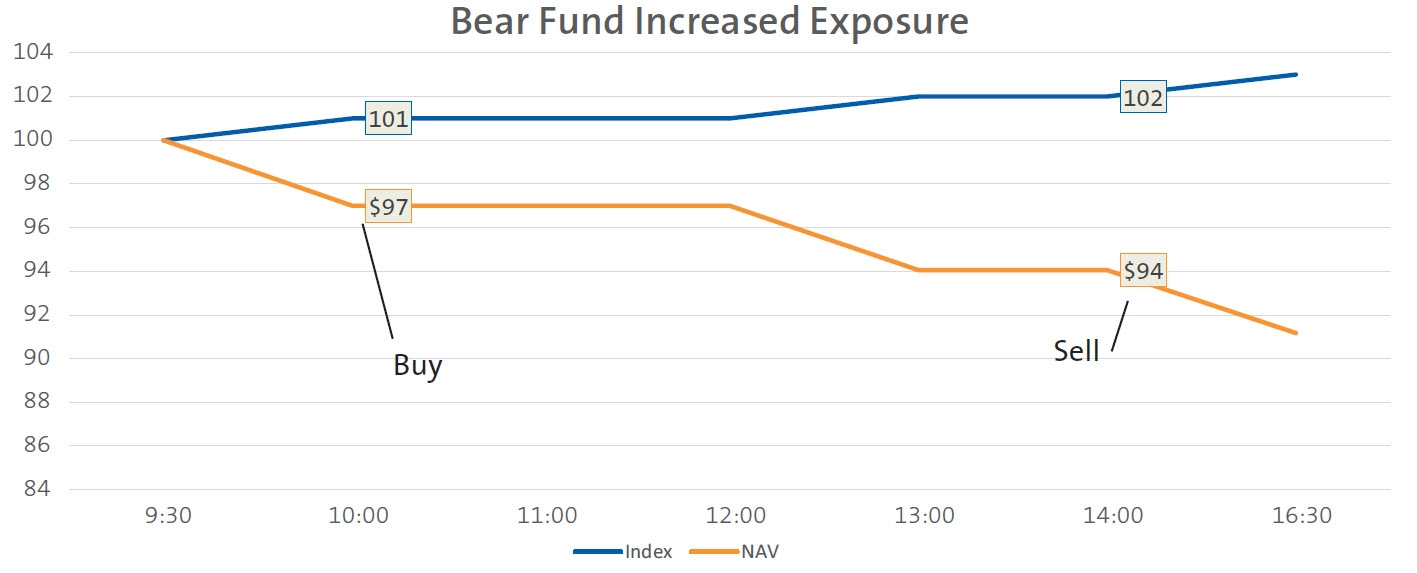
| Time of Purchase | 10:00 AM |
| Index Value | 101 |
| Bear NAV | $97 |
| Bear Exposure | -306% |
| Initial Investment | $10,000 |
| Time of Sale | 2:00 PM |
| Index Value | 102 |
| Bear NAV | $94 |
| Fund Return | -3.03% |
| Index Return | 0.99% |
| Fund/Index Return | -306% |
| Investment at Sale | $9,697 |
Scenario #4: Bear Fund Purchased at a Decreased Exposure Level
In the first ½ hour of the trading day, the index has lost 1% (moved from 100 to 99). An investor that purchases the fund at 10:00AM, at an intraday NAV of $103, would obtain inverse exposure to the index in the amount of 294%, not 300%. After the purchase, the target index moves from 99 to 102 (3.03% return) at 2:00PM, at which point the investor sells. During this same period, the Bear Fund’s intraday NAV drops from $103 to $94, a loss of -8.80%, which is -294% of the target index move.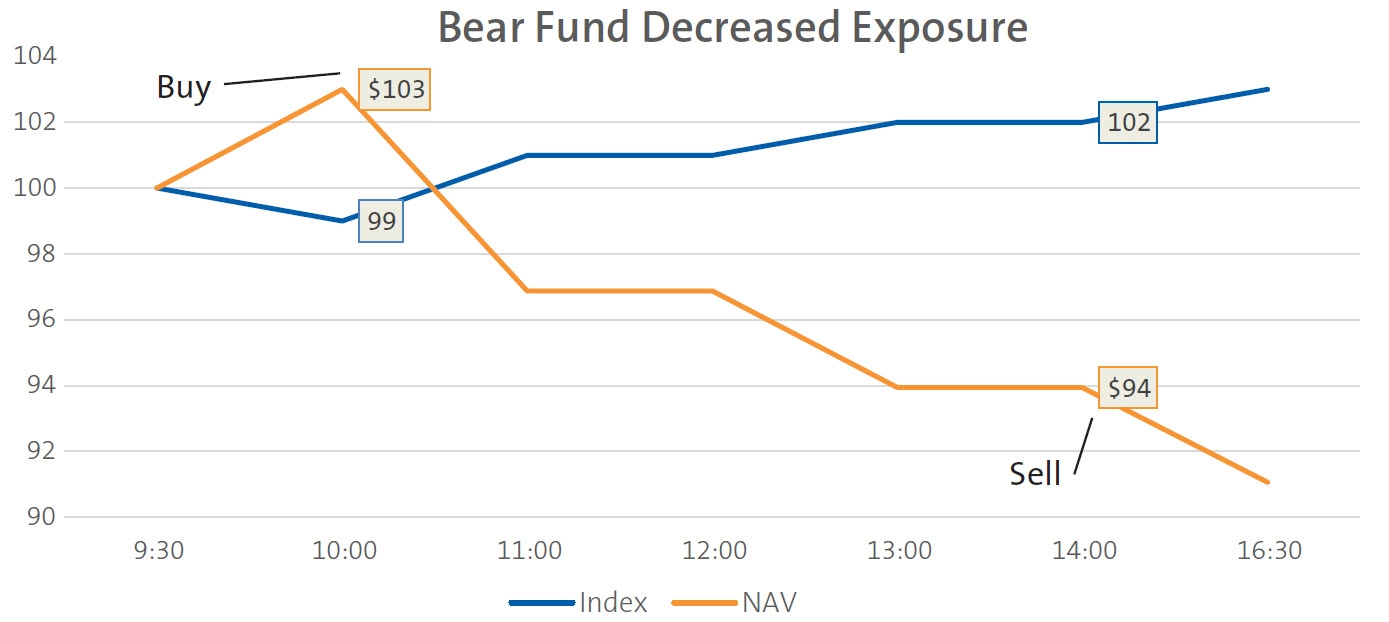
| Time of Purchase | 10:00 AM |
| Index Value | 99 |
| Bear NAV | $103 |
| Bear Exposure | -294% |
| Initial Investment | $10,000 |
| Time of Sale | |
| Index Value | 102 |
| Bear NAV | $94 |
| Fund Return | -8.80% |
| Index Return | 3.03% |
| Fund/Index Return | -294% |
| Investment at Sale | $9,120 |
Important Take Aways
- If an investor purchases shares of a Direxion Daily Leveraged or Inverse 3X ETF at any value other than the previous day’s closing NAV during the day, the level of exposure will depend on the magnitude of the movement of the target index.
- If the movement is in favor of the Fund, the level of exposure will be less than the Fund’s stated daily exposure target of 300% for a Bull Fund and -300% for a Bear Fund.
- If the movement is not in favor of the Fund, the level of exposure will be greater than the Fund’s stated daily exposure target of 300% for a Bull Fund and -300% for a Bear Fund.
- Once the investor has purchased shares of a Fund, the investor’s level of exposure is set until he or she sells that position or until the Fund’s next portfolio rebalance at the end of the day.
- Remember to watch the iNAV and understand exposure levels at the time of purchase.
Direxion Daily Leveraged & Inverse ETFs are designed for sophisticated investors who:
- Understand the risks associated with the use of leverage
- Understand the consequences of seeking daily leveraged investment results
- For a Bear Fund, understand the risk of shorting
- Intend to actively monitor and manage their investments
These funds are not suited for conservative investors who:
- Cannot tolerate substantial losses in short periods of time
- Are unfamiliar with the unique nature and performance characteristics of funds that seek leveraged & inverse daily investment results
- Are long-term investors who do not monitor their portfolios frequently
An investor should carefully consider a Fund’s investment objective, risks, charges, and expenses before investing. A Fund’s prospectus and summary prospectus contain this and other information about the Direxion Shares. To obtain a Fund’s prospectus and summary prospectus call 866-476-7523 or visit our website at direxion.com. A Fund’s prospectus and summary prospectus should be read carefully before investing.
Leveraged and Inverse ETFs pursue daily leveraged investment objectives which means they are riskier than alternatives which do not use leverage. They seek daily goals and should not be expected to track the underlying index over periods longer than one day. They are not suitable for all investors and should be utilized only by sophisticated investors who understand leverage risk and who actively manage their investments.
Direxion Shares ETF Risks - An investment in the ETFs involves risk, including the possible loss of principal. The ETFs are non-diversified and include risks associated with concentration that results from an ETF’s investments in a particular industry or sector which can increase volatility. The use of derivatives such as futures contracts and swaps are subject to market risks that may cause their price to fluctuate over time. The ETFs do notattempt to, and should not be expected to, provide returns which are a multiple of the return of their respective index for periods other than a single day. For other risks including leverage, correlation, daily compounding, market volatility and risks specific to an industry or sector, please read the prospectus.